349 KiB
- Custom Pages
- Pages
- Posts
- Backup
- Configuration Management
- Container
- K3s
- Kubernetes
- MISC
- Nikola
- Nix
- Revision Control
- RSS
- IRC
- Text Editors
- Footnotes
- COMMENT Local Variables
Custom Pages
Pages
About
Who am I ?
I am a DevOps cloud engineer with a passion for technology, automation, Linux and OpenSource. I've been on Linux since the early 2000's and have contributed, in some small capacity, to some open source projects along the way.
I dabble in this space and I blog about it. This is how I learn, this is how I evolve.
Contact Me
If, for some reason, you'd like to get in touch you have sevaral options.
- Find me on libera in
#LearnAndTeach. - Email me at
blog[at]lazkani[dot]io
If you use GPG and you should, my public key is 2383 8945 E07E 670A 4BFE 39E6 FBD8 1F2B 1F48 8C2B
FAQ
What is this ?
This is my humble blog where I post things related to DevOps in hope that I or someone else might benefit from it.
Wait what ? What is DevOps ?
Duckduckgo defines DevOps as:
DevOps is a software engineering culture and practice that aims at unifying software development and software operation. The main characteristic of the DevOps movement is to strongly advocate automation and monitoring at all steps of software construction, from integration, testing, releasing to deployment and infrastructure management. DevOps aims at shorter development cycles, increased deployment frequency, and more dependable releases, in close alignment with business objectives.
In short, we build an infrastructure that is easily deployable, maintainable and, in all forms, makes the lives of the developers a breeze.
What do you blog about ?
Anything and everything related to DevOps. The field is very big and complex with a lot of different tools and technologies implemented.
I try to blog about interesting and new things as much as possible, when time permits.
Does this blog have RSS ?
Yup, here's the link.
Posts
Backup @backup
DONE BorgBackup borg borgbackup
I usually lurk around Freenode in a few projects that I use, can learn from and/or help with. This is a great opportunity to learn new things all the time.
This story is familiar in that manner, but that's where similarities diverge. Someone asked around #Weechat a question that caught my attention because it was, sort of, out of topic. The question was around how do you backup your stuff ?
I mean if I were asked that, I would've mentioned revision controlled off-site repositories for the code that I have.
For the personal stuff on the other hand, I would've admitted simple rudimentary solutions like rsync, tar and external drives.
So I was sort of happy with my backup solution, it has worked. Plain and simple.
I have to admit that, by modern standards it might not offer the ability to go back in time to a certain point. But I use file systems that offer snapshot capabilities. I can recover from previous snapshots and send them somewhere safe. Archiving and encrypting those is not a simple process, wish it was. That limits storage possibilities if you care to keep your data private.
But if you know me, you'd know that I'm always open to new ways of doing things.
I can't remember exactly the conversation but the name BorgBackup was mentioned (thank you however you are). That's when things changed.
BorgBackup
Borg is defined as a
Deduplicating archiver with compression and encryption
Although this is a very accurate and encompassing definition, it doesn't really show you how AWESOME this thing is.
I had to go to the docs first before I stumbled upon this video.
It can be a bit difficult to follow the video, I understand.
This is why I decided to write this post, to sort of explain to you how Borg can backup your stuff.
Encryption
Oh yeah, that's the first thing I look at when I consider any suggested backup solution. Borg offers built-in encryption and authentication. You can read about it in details in the docs.
So that's a check.
Compression
This is another thing I look for in a suggested backup solution. And I'm happy to report that Borg has this under the belt as well. Borg currently supports LZ4, zlib, LZMA and zstd. You can also tune the level of compression. Pretty neat !
Full Backup
I've watched a few videos and read a bit of their documentation and they talk about FULL BACKUP. Which means every time you run Borg, it will take a full backup of your stuff. A full backup at that point in time, don't forget. The implication of this is that you have a versioned list of your backups, and you can go back in time to any of them.
Yes, you read that right. Borg does a full backup every time you run it. That's a pretty neat feature.
If you're a bit ahead of me, you were gonna say woooow there bud ! I have Gigabytes of data, what do you mean FULL BACKUP, you keep saying FULL BACKUP.
I mean FULL BACKUP, wait until you hear about the next feature.
Deduplication
Booyah ! It has deduplication. Ain't that awesome. I've watched a presentation by the project's original maintainer explain this. I have one thing to say. It's pretty good. How good, you may ask ?
My answer would be, good enough to fool me into thinking that it was taking snapshots of my data.
 -----------------------------------------------------------------------------
                             Original size      Compressed size    Deduplicated size
 All archives:               34.59 GB           9.63 GB            1.28 GB
 Unique chunks               Total chunks
 Chunk index:                47772              469277
It wasn't until I dug in deeper into the matter that I understood that it was a full backup and the deduping taking care of the rest.
Check
Borg offers a way to vefiry the consistency of the repository and the archives within. This way, you can make sure that your backups haven't been corrupted.
This is a very good feature, and a must in my opinion from a backup solution. Borg has YOU covered.
Restore
A backup solution is nothing if you can't get your data backup. Borg has a few ways for you to get your data. You can either create an archive file out of a backup. You can export a file, a directory or the whole directory tree from a backup. You can also, if you like, mount a backup and get stuff out.
Warning
Mounting a Borg backup is done using fuse
Conclusion
Borg is a great tool for backup. It comes in an easily installable self-contained binary so you can use it, pretty much, anywhere giving you no excuse whatsoever not to use it. Their documentation is very good, and Borg is easy to use. It offers you all the features you need to do off-site and on-site backups of all your important data.
I'll be testing Borg moving forward for my data. I'll make sure to report back anything I find, in the future, related to the subject.
DONE Automating Borg borgmatic borgbackup borg
In the previous blog post entitle #borgbackup, I talked about borg. If you read that post, you would've noticed that borg has a lot of features. With a lot of features come a lot of automation.
If you were thinking about using borg, you should either make a simple cron or you're gonna have to write an elaborate script to take care of all the different steps.
What if I told you there's another way ? An easier way ! The Borgmatic way… What would you say ?
Borgmatic
Borgmatic is defined on their website as follows.
borgmatic is simple, configuration-driven backup software for servers and workstations. Protect your files with client-side encryption. Backup your databases too. Monitor it all with integrated third-party services.
If you go down to it, borgmatic uses borg's API to automate a list of configurable tasks. This way, it saves you the trouble of writing your own scripts to automate these steps.
Borgmatic uses a YAML configuration file. Let's configure a few tasks.
Location
First, let's start by configuring the locations that borg is going to be working with.
location:
    source_directories:
        - /home/

    repositories:
        - user@backupserver:sourcehostname.borg

    one_file_system: true

    exclude_patterns:
        - /home/*/.cache
        - '*.pyc'
This tells borg that we need to backup our /home directories excluding a few patterns.
Let's not forget that we told borg where the repository is located at.
Storage
We need to configure the storage next.
storage:
    # Recommended
    # encryption_passcommand: secret-tool lookup borg-repository repo-name

    encryption_passphrase: "ReallyStrongPassphrase"
    compression: zstd,15
    ssh_command: ssh -i /path/to/private/key
    borg_security_directory: /path/to/base/config/security
    archive_name_format: 'borgmatic-{hostname}-{now}'
In this section, we tell borg a little big of information about our repository. What are the credentials, where it can find them, etc.
The easy way is to go with a passphrase, but I recommend using an encryption_passcommand instead.
I also use zstd for encryption instead of lz4, you better do your research before you change the default.
I also recommend, just as they do, the use of a security directory as well.
Retention
We can configure a retention for our backups, if we like.
retention:
    keep_hourly: 7
    keep_daily: 7
    keep_weekly: 4
    keep_monthly: 6
    keep_yearly: 2

    prefix: "borgmatic-"
The part of what to keep from hourly to daily is self explanatory.
I would like to point out the prefix part as it is important.
This is the prefix that borgmatic uses to consider backups for pruning.
Warning
Watch out for the retention prefix
Consistency
After the updates, we'd like to check our backups.
consistency:
    checks:
        - repository
        - archives

    check_last: 3

    prefix: "borgmatic-"
Warning
Watch out, again, for the consistency prefix
Hooks
Finally, hooks.
I'm going to talk about hooks a bit. Hooks can be used to backup MySQL, PostgreSQL or MariaDB.
They can also be hooks for on_error, before_backup, after_backup, before_everything and after_everything.
You can also hook to third party services which you can check on their webpage.
I deployed my own, so I configured my own.
Borgmatic Configuration
Let's put everything together now.
location:
    source_directories:
        - /home/

    repositories:
        - user@backupserver:sourcehostname.borg

    one_file_system: true

    exclude_patterns:
        - /home/*/.cache
        - '*.pyc'

storage:
    # Recommended
    # encryption_passcommand: secret-tool lookup borg-repository repo-name

    encryption_passphrase: "ReallyStrongPassphrase"
    compression: zstd,15
    ssh_command: ssh -i /path/to/private/key
    borg_security_directory: /path/to/base/config/security
    archive_name_format: 'borgmatic-{hostname}-{now}'

retention:
    keep_hourly: 7
    keep_daily: 7
    keep_weekly: 4
    keep_monthly: 6
    keep_yearly: 2

    prefix: "borgmatic-"

consistency:
    checks:
        - repository
        - archives

    check_last: 3

    prefix: "borgmatic-"
Now that we have everything together, let's save it in /etc/borgmatic.d/home.yaml.
Usage
If you have borg and borgmatic already installed on your system and the borgmatic configuration file in place, you can test it out.
You can create the repository.
# borgmatic init -v 2
You can list the backups for the repository.
 # borgmatic list --last 5
 borgmatic-home-2020-01-30T22:01:30 Thu, 2020-01-30 22:01:42 [0000000000000000000000000000000000000000000000000000000000000000]
 borgmatic-home-2020-01-31T22:02:12 Fri, 2020-01-31 22:02:24 [0000000000000000000000000000000000000000000000000000000000000000]
 borgmatic-home-2020-02-01T22:01:34 Sat, 2020-02-01 22:01:45 [0000000000000000000000000000000000000000000000000000000000000000]
 borgmatic-home-2020-02-02T16:01:22 Sun, 2020-02-02 16:01:32 [0000000000000000000000000000000000000000000000000000000000000000]
 borgmatic-home-2020-02-02T18:01:36 Sun, 2020-02-02 18:01:47 [0000000000000000000000000000000000000000000000000000000000000000]
You could run a check.
 # borgmatic check -v 1
 /etc/borgmatic.d/home.yaml: Pinging Healthchecks start
 /borg/home: Running consistency checks
 Remote: Starting repository check
 Remote: Starting repository index check
 Remote: Completed repository check, no problems found.
 Starting archive consistency check...
 Analyzing archive borgmatic-home-2020-02-01T22:01:34 (1/3)
 Analyzing archive borgmatic-home-2020-02-02T16:01:22 (2/3)
 Analyzing archive borgmatic-home-2020-02-02T18:01:36 (3/3)
 Orphaned objects check skipped (needs all archives checked).
 Archive consistency check complete, no problems found.

 summary:
 /etc/borgmatic.d/home.yaml: Successfully ran configuration file
But most of all, if you simply run borgmatic without any parameters, it will run through the whole configuration and apply all the steps.
At this point, you can simply add the borgmatic command in a cron to run on an interval.
The other options would be to configure a systemd timer and service to run this on an interval.
The latter is usually provided to you if you used your package manager to install borgmatic.
Conclusion
If you've checked borg and found it too much work to script, give borgmatic a try. I've been using borgmatic for few weeks now with no issues at all. I recently hooked it to a monitoring system so I will have a better view on when it runs, how much time each run takes. Also, if any of my backups fail I get notified by email. I hope you enjoy borg and borgmatic as much as I am.
DONE Dotfiles with Chezmoi dotfiles chezmoi encryption templates
A few months ago, I went on a search for a solution for my dotfiles.
I tried projects likes GNU Stow, dotbot and a bare git repository. Each one of these solutions has its advantages and its advantages, but I found mine in Chezmoi.
Chezmoi ? That's French right ? How is learning French going to help me ?
Introduction
On a *nix system, whether Linux, BSD or even Mac OS now, the applications one uses have their configuration saved in the user's home directory. These files are called configuration files. Usually, these configuration files start with a . which on these systems designate hidden files (they do not show up with a simple ls). Due their names, these configuration files are also referred to as dotfiles.
Note
I will be using dotfiles and configuration files interchangeably in this article, and they can be thought as such.
One example of such files is the .bashrc file found in the user's home directory. It allows the user to configure bash and change some behaviours.
Now that we understand what dotfiles are, let's talk a little bit about the previously mentioned solutions. They deserve mentioning, especially if you're looking for such solution.
GNU Stow
GNU Stow leverages the power of symlinks to keep your configuration in a centralized location. Wherever your repository lives, GNU Stow will mimic the internal structure of said repository in your home directory by smartly symlinking everything.
I said smartly because it tries to minimize the amount of symlinks created by symlinking to common root directories if possible.
By having all your configuration files under one directory structure, it is easier to push it to any public repository and share it with others.
The downsize is, you end-up with a lot of symlinks. It is also worth mentioning that not all applications behave well when their configuration directories are symlinked. Otherwise, GNU Stow is a great project.
Dotbot
Dotbot is a Python project that aims at automating your dotfiles. It gives you great control over what and how to manage your dotfiles.
Having it written in Python means it is very easy to install; pip. It also means that it should be easy to migrate it to different systems.
Dotbot has a lot going for it. If the idea of having control over every aspect of your dotfiles, including the possibility of the setup of the environment along with it, then dotbot is for you.
Well, it's not for me.
Bare Git Repository
This is arguably the most elegant solution of them all.
The nice thing about this solution is its simplicity and cleanliness. It is essentially creating a bare git repository somewhere in your home directory specifying the home directory itself to be the working directory.
If you are wondering where one would use a bare git repository in real life other than this use case. Well, you have no other place to turn than any git server. On the server, Gitea for example, your repository is only a bare repository. One has to clone it to get the working directory along with it.
Anyway, back to our topic. This is a great solution if you don't have to worry about things you would like to hide.
By hide, I mean things like credentials, keys or passwords which never belong in a repository. You will need to find solutions for these types of files. I was looking for something less involving and more involved.
Chezmoi to the rescue ?
Isn't that what they all say ?
I like how the creator(s) defines Chezmoi
Manage your dotfiles across multiple machines, securely.
Pretty basic, straight to the point. Unfortunately, it's a little bit harder to grasp the concept of how it works.
Chezmoi basically generates the dotfiles from the local repository. These dotfiles are saved in different forms in the repository but they always generate the same output; the dotfiles. Think of Chezmoi as a dotfiles templating engine, at its basic form it saves your dotfiles as is and deploys them in any machine.
Working with Chezmoi
I think we should take a quick look at Chezmoi to see how it works.
Chezmoi is written Golang making it fairly easy to install so I will forgo that boring part.
First run
To start using Chezmoi, one has to initialize a new Chezmoi repository.
chezmoi init
This will create a new git repository in ~/.local/share/chezmoi. This is now the source state, where Chezmoi will get your dotfiles.
Plain dotfiles management with Chezmoi
Now that we have a Chezmoi repository. We can start to populate it with dotfiles.
Let's assume that we would like to start managing one of our dotfiles with Chezmoi. I'm going with an imaginary application's configuration directory. This directory will hold different files with versatile content types. This is going to showcase some of Chezmoi's capabilities.
Note
This is how I use Chezmoi. If you have a better way to do things, I'd like to hear about it!
This DS9 application has its directory configuration in ~/.ds9/ where we find the config.
The configuration looks like any generic ini configuration.
[character/sisko]
Name = Benjamin
Rank = Captain
Credentials = sisko-creds.cred
Mastodon = sisko-api.mastodon
Nothing special about this file, let's add it to Chezmoi
chezmoi add ~/.ds9/configAnd nothing happened… Hmm…
chezmoi managed/home/user/.ds9 /home/user/.ds9/config
Okay, it seems that it is being managed.
We can test it out by doing something like this.
mv ~/.ds9/config ~/.ds9/config.old
chezmoi diff
install -m 644 /dev/null /home/user/.ds9/config --- a/home/user/.ds9/config +++ b/home/user/.ds9/config @@ -0,0 +1,5 @@ +[character/sisko] +Name = Benjamin +Rank = Captain +Credentials = sisko-creds.cred +Mastodon = sisko-api.mastodon
Alright, everything looks as it should be.
But that's only a diff, how do I make Chezmoi apply the changes because my dotfile is still config.old.
Okay, we can actually get rid of the config.old file and make Chezmoi regenerate the configuration.
rm ~/.ds9/config ~/.ds9/config.old
chezmoi -v applyNote
I like to use the -v flag to check what is actually being applied.
install -m 644 /dev/null /home/user/.ds9/config
--- a/home/user/.ds9/config
+++ b/home/user/.ds9/config
@@ -0,0 +1,5 @@
+[character/sisko]
+Name = Benjamin
+Rank = Captain
+Credentials = sisko-creds.cred
+Mastodon = sisko-api.mastodon
And we get the same output as the diff. Nice!
The configuration file was also recreated, that's awesome.
If you've followed so far, you might have wondered… If I edit ~/.ds9/config, then Chezmoi is going to override it!
YES, yes it will.
Warning
Always use Chezmoi to edit your managed dotfiles. Do NOT edit them directly.
ALWAYS use chezmoi diff before every applying.
To edit your managed dotfile, simply tell Chezmoi about it.
chezmoi edit ~/.ds9/config
Chezmoi will use your $EDITOR to open the file for you to edit. Once saved, it's saved in the repository database.
Be aware, at this point the changes are not reflected in your home directory, only in the Chezmoi source state. Make sure you diff and then apply to make the changes in your home.
Chezmoi repository management
As mentioned previously, the repository is found in ~/.local/share/chezmoi.
I always forget where it is, luckily Chezmoi has a solution for that.
chezmoi cd
Now, we are in the repository. We can work with it as a regultar git repository.
When you're done, don't forget to exit.
Other features
It is worth mentioning at this point that Chezmoi offers a few more integrations.
Due to the fact that Chezmoi is written in Golang, it can leverage the power of the Golang templating system.
One can replace repeatable values like email or name with a template like {{ .email }} or {{ .name }}.
This will result in a replacement of these templated variables with their real values in the resulting dotfile. This is another reason why you should always edit your managed dotfiles through Chezmoi.
Our previous example would look a bit different.
[character/sisko]
Name = {{ .sisko.name }}
Rank = {{ .sisko.rank }}
Credentials = sisko-creds.cred
Mastodon = sisko-api.mastodon
And we would add it a bit differently now.
chezmoi add --template ~/.ds9/configWarning
Follow the documentation to configure the values.
Once you have the power of templating on your side, you can always take it one step further. Chezmoi has integration with a big list of password managers. These can be used directly into the configuration files.
In our hypothetical example, we can think of the credentials file (~/.ds9/sisko-creds.cred).
Name = {{ (keepassxc "sisko.ds9").Name }}
Rank = {{ (keepassxc "sisko.ds9").Rank }}
Access_Code = {{ (keepassxc "sisko.ds9").AccessCode }}
Do not forget that this is also using the templating engine. So you need to add as a template.
chezmoi add --template ~/.ds9/sisko-creds.credWait, what ! You almost slipped away right there old fellow.
We have our Mastodon API key in the sisko-api.mastodon file. The whole file cannot be pushed to a repository.
It turns out that Chezmoi can use gpg to encrypt your files making it possible for you to push them.
To add a file encrypted to the Chezmoi repository, use the following command.
chezmoi add --encrypt ~/.ds9/sisko-api.mastodonThere is a list of other features that Chezmoi supports that I did not mention. I did not use all the features offered yet. You should check the website for the full documentation.
Conclusion
I am fully migrated into Chezmoi so far. I have used all the features above, and it has worked flawlessly so far.
I like the idea that it offers all the features I need while at the same time staying out of the way. I find myself, often, editing the dotfiles in my home directory as a dev version. Once I get to a configuration I like, I add it to Chezmoi. If I ever mess up badly, I ask Chezmoi to override my changes.
I understand it adds a little bit of overhead with the use of chezmoi commands, which I aliased to cm. But the end result is a home directory which seems untouched by any tools (no symlinks, no copies, etc…) making it easier to migrate out of Chezmoi as a solution and into another one if I ever choose in the future.
Configuration Management @configuration_management
DONE Ansible testing with Molecule ansible molecule
When I first started using ansible, I did not know about molecule. It was a bit daunting to start a role from scratch and trying to develop it without having the ability to test it. Then a co-worker of mine told me about molecule and everything changed.
I do not have any of the tools I need installed on this machine, so I will go through, step by step, how I set up ansible and molecule on any new machine I come across for writing ansible roles.
Requirements
What we are trying to achieve in this post, is a working ansible role that can be tested inside a docker container. To be able to achieve that, we need to install docker on the system. Follow the instructions on installing docker found on the docker website.
Good Practices
First thing's first. Let's start by making sure that we have python installed properly on the system.
 $ python --version
 Python 3.7.1
Because in this case I have python3 installed, I can create a virtualenv easier without the use of external tools.
 # Create the directory to work with
 $ mkdir -p sandbox/test-roles
 # Navigate to the directory
 $ cd sandbox/test-roles/
 # Create the virtualenv
 ~/sandbox/test-roles $ python -m venv .ansible-venv
 # Activate the virtualenv
 ~/sandbox/test-roles $ source .ansible-venv/bin/activate
 # Check that your virtualenv activated properly
 (.ansible-venv) ~/sandbox/test-roles $ which python
 /home/elijah/sandbox/test-roles/.ansible-venv/bin/python
At this point, we can install the required dependencies.
 $ pip install ansible molecule docker
 Collecting ansible
   Downloading https://files.pythonhosted.org/packages/56/fb/b661ae256c5e4a5c42859860f59f9a1a0b82fbc481306b30e3c5159d519d/ansible-2.7.5.tar.gz (11.8MB)
     100% |████████████████████████████████| 11.8MB 3.8MB/s
 Collecting molecule
   Downloading https://files.pythonhosted.org/packages/84/97/e5764079cb7942d0fa68b832cb9948274abb42b72d9b7fe4a214e7943786/molecule-2.19.0-py3-none-any.whl (180kB)
     100% |████████████████████████████████| 184kB 2.2MB/s

 ...

 Successfully built ansible ansible-lint anyconfig cerberus psutil click-completion tabulate tree-format pathspec future pycparser arrow
 Installing collected packages: MarkupSafe, jinja2, PyYAML, six, pycparser, cffi, pynacl, idna, asn1crypto, cryptography, bcrypt, paramiko, ansible, pbr, git-url-parse, monotonic, fasteners, click, colorama, sh, python-gilt, ansible-lint, pathspec, yamllint, anyconfig, cerberus, psutil, more-itertools, py, attrs, pluggy, atomicwrites, pytest, testinfra, ptyprocess, pexpect, click-completion, tabulate, future, chardet, binaryornot, poyo, urllib3, certifi, requests, python-dateutil, arrow, jinja2-time, whichcraft, cookiecutter, tree-format, molecule, docker-pycreds, websocket-client, docker
 Successfully installed MarkupSafe-1.1.0 PyYAML-3.13 ansible-2.7.5 ansible-lint-3.4.23 anyconfig-0.9.7 arrow-0.13.0 asn1crypto-0.24.0 atomicwrites-1.2.1 attrs-18.2.0 bcrypt-3.1.5 binaryornot-0.4.4 cerberus-1.2 certifi-2018.11.29 cffi-1.11.5 chardet-3.0.4 click-6.7 click-completion-0.3.1 colorama-0.3.9 cookiecutter-1.6.0 cryptography-2.4.2 docker-3.7.0 docker-pycreds-0.4.0 fasteners-0.14.1 future-0.17.1 git-url-parse-1.1.0 idna-2.8 jinja2-2.10 jinja2-time-0.2.0 molecule-2.19.0 monotonic-1.5 more-itertools-5.0.0 paramiko-2.4.2 pathspec-0.5.9 pbr-4.1.0 pexpect-4.6.0 pluggy-0.8.1 poyo-0.4.2 psutil-5.4.6 ptyprocess-0.6.0 py-1.7.0 pycparser-2.19 pynacl-1.3.0 pytest-4.1.0 python-dateutil-2.7.5 python-gilt-1.2.1 requests-2.21.0 sh-1.12.14 six-1.11.0 tabulate-0.8.2 testinfra-1.16.0 tree-format-0.1.2 urllib3-1.24.1 websocket-client-0.54.0 whichcraft-0.5.2 yamllint-1.11.1
Creating your first ansible role
Once all the steps above are complete, we can start by creating our first ansible role.
 $ molecule init role -r example-role
 --> Initializing new role example-role...
 Initialized role in /home/elijah/sandbox/test-roles/example-role successfully.

 $ tree example-role/
 example-role/
 ├── defaults
 │   └── main.yml
 ├── handlers
 │   └── main.yml
 ├── meta
 │   └── main.yml
 ├── molecule
 │   └── default
 │       ├── Dockerfile.j2
 │       ├── INSTALL.rst
 │       ├── molecule.yml
 │       ├── playbook.yml
 │       └── tests
 │           ├── __pycache__
 │           │   └── test_default.cpython-37.pyc
 │           └── test_default.py
 ├── README.md
 ├── tasks
 │   └── main.yml
 └── vars
     └── main.yml

 9 directories, 12 files
You can find what each directory is for and how ansible works by visiting docs.ansible.com.
meta/main.yml
The meta file needs to modified and filled with information about the role. This is not a required file to modify if you are keeping this for yourself, for example. But it is a good idea to have as much information as possible if this is going to be released. In my case, I don't need any fanciness as this is just sample code.
---
galaxy_info:
  author: Elia el Lazkani
  description: This is an example ansible role to showcase molecule at work
  license: license (BDS-2)
  min_ansible_version: 2.7
  galaxy_tags: []
dependencies: []
tasks/main.yml
This is where the magic is set in motion. Tasks are the smallest entities in a role that do small and idempotent actions. Let's write a few simple tasks to create a user and install a service.
---
# Create the user example
- name: Create 'example' user
  user:
    name: example
    comment: Example user
    shell: /bin/bash
    state: present
    create_home: yes
    home: /home/example

# Install nginx
- name: Install nginx
  apt:
    name: nginx
    state: present
    update_cache: yes
  notify: Restart nginx
handlers/main.yml
If you noticed, we are notifying a handler to be called after installing nginx. All handlers notified will run after all the tasks complete and each handler will only run once. This is a good way to make sure that you don't restart nginx multiple times if you call the handler more than once.
---
# Handler to restart nginx
- name: Restart nginx
  service:
    name: nginx
    state: restarted
molecule/default/molecule.yml
It's time to configure molecule to do what we need. We need to start an ubuntu docker container, so we need to specify that in the molecule YAML file. All we need to do is change the image line to specify that we want an ubuntu:bionic image.
---
dependency:
  name: galaxy
driver:
  name: docker
lint:
  name: yamllint
platforms:
  - name: instance
    image: ubuntu:bionic
provisioner:
  name: ansible
  lint:
    name: ansible-lint
scenario:
  name: default
verifier:
  name: testinfra
  lint:
    name: flake8
molecule/default/playbook.yml
This is the playbook that molecule will run. Make sure that you have all the steps that you need here. I will keep this as is.
---
- name: Converge
  hosts: all
  roles:
    - role: example-role
First Role Pass
This is time to test our role and see what's going on.
 (.ansible-role) ~/sandbox/test-roles/example-role/ $ molecule converge
 --> Validating schema /home/elijah/sandbox/test-roles/example-role/molecule/default/molecule.yml.
 Validation completed successfully.
 --> Test matrix

 └── default
     ├── dependency
     ├── create
     ├── prepare
     └── converge

 --> Scenario: 'default'
 --> Action: 'dependency'
 Skipping, missing the requirements file.
 --> Scenario: 'default'
 --> Action: 'create'

     PLAY [Create] ******************************************************************

     TASK [Log into a Docker registry] **********************************************
     skipping: [localhost] => (item=None)

     TASK [Create Dockerfiles from image names] *************************************
     changed: [localhost] => (item=None)
     changed: [localhost]

     TASK [Discover local Docker images] ********************************************
     ok: [localhost] => (item=None)
     ok: [localhost]

     TASK [Build an Ansible compatible image] ***************************************
     changed: [localhost] => (item=None)
     changed: [localhost]

     TASK [Create docker network(s)] ************************************************

     TASK [Create molecule instance(s)] *********************************************
     changed: [localhost] => (item=None)
     changed: [localhost]

     TASK [Wait for instance(s) creation to complete] *******************************
     changed: [localhost] => (item=None)
     changed: [localhost]

     PLAY RECAP *********************************************************************
     localhost                  : ok=5    changed=4    unreachable=0    failed=0


 --> Scenario: 'default'
 --> Action: 'prepare'
 Skipping, prepare playbook not configured.
 --> Scenario: 'default'
 --> Action: 'converge'

     PLAY [Converge] ****************************************************************

     TASK [Gathering Facts] *********************************************************
     ok: [instance]

     TASK [example-role : Create 'example' user] ************************************
     changed: [instance]

     TASK [example-role : Install nginx] ********************************************
     changed: [instance]

     RUNNING HANDLER [example-role : Restart nginx] *********************************
     changed: [instance]

     PLAY RECAP *********************************************************************
     instance                   : ok=4    changed=3    unreachable=0    failed=0
It looks like the converge step succeeded.
Writing Tests
It is always a good practice to write unittests when you're writing code. Ansible roles should not be an exception. Molecule offers a way to run tests, which you can think of as unittest, to make sure that what the role gives you is what you were expecting. This helps future development of the role and keeps you from falling in previously solved traps.
molecule/default/tests/test_default.py
Molecule leverages the testinfra project to run its tests. You can use other tools if you so wish, and there are many. In this example we will be using testinfra.
import os

import testinfra.utils.ansible_runner

testinfra_hosts = testinfra.utils.ansible_runner.AnsibleRunner(
    os.environ['MOLECULE_INVENTORY_FILE']).get_hosts('all')


def test_hosts_file(host):
    f = host.file('/etc/hosts')

    assert f.exists
    assert f.user == 'root'
    assert f.group == 'root'


def test_user_created(host):
    user = host.user("example")
    assert user.name == "example"
    assert user.home == "/home/example"


def test_user_home_exists(host):
    user_home = host.file("/home/example")
    assert user_home.exists
    assert user_home.is_directory


def test_nginx_is_installed(host):
    nginx = host.package("nginx")
    assert nginx.is_installed


def test_nginx_running_and_enabled(host):
    nginx = host.service("nginx")
    assert nginx.is_running
Warning
Uncomment truthy: disable in .yamllint found at the base of the role.
 (.ansible_venv) ~/sandbox/test-roles/example-role $ molecule test
 --> Validating schema /home/elijah/sandbox/test-roles/example-role/molecule/default/molecule.yml.
 Validation completed successfully.
 --> Test matrix

 └── default
     ├── lint
     ├── destroy
     ├── dependency
     ├── syntax
     ├── create
     ├── prepare
     ├── converge
     ├── idempotence
     ├── side_effect
     ├── verify
     └── destroy

 --> Scenario: 'default'
 --> Action: 'lint'
 --> Executing Yamllint on files found in /home/elijah/sandbox/test-roles/example-role/...
 Lint completed successfully.
 --> Executing Flake8 on files found in /home/elijah/sandbox/test-roles/example-role/molecule/default/tests/...
 /home/elijah/.virtualenvs/world/lib/python3.7/site-packages/pycodestyle.py:113: FutureWarning: Possible nested set at position 1
   EXTRANEOUS_WHITESPACE_REGEX = re.compile(r'[[({] | []}),;:]')
 Lint completed successfully.
 --> Executing Ansible Lint on /home/elijah/sandbox/test-roles/example-role/molecule/default/playbook.yml...
 Lint completed successfully.
 --> Scenario: 'default'
 --> Action: 'destroy'

     PLAY [Destroy] *****************************************************************

     TASK [Destroy molecule instance(s)] ********************************************
     changed: [localhost] => (item=None)
     changed: [localhost]

     TASK [Wait for instance(s) deletion to complete] *******************************
     ok: [localhost] => (item=None)
     ok: [localhost]

     TASK [Delete docker network(s)] ************************************************

     PLAY RECAP *********************************************************************
     localhost                  : ok=2    changed=1    unreachable=0    failed=0


 --> Scenario: 'default'
 --> Action: 'dependency'
 Skipping, missing the requirements file.
 --> Scenario: 'default'
 --> Action: 'syntax'

     playbook: /home/elijah/sandbox/test-roles/example-role/molecule/default/playbook.yml

 --> Scenario: 'default'
 --> Action: 'create'

     PLAY [Create] ******************************************************************

     TASK [Log into a Docker registry] **********************************************
     skipping: [localhost] => (item=None)

     TASK [Create Dockerfiles from image names] *************************************
     changed: [localhost] => (item=None)
     changed: [localhost]

     TASK [Discover local Docker images] ********************************************
     ok: [localhost] => (item=None)
     ok: [localhost]

     TASK [Build an Ansible compatible image] ***************************************
     changed: [localhost] => (item=None)
     changed: [localhost]

     TASK [Create docker network(s)] ************************************************

     TASK [Create molecule instance(s)] *********************************************
     changed: [localhost] => (item=None)
     changed: [localhost]

     TASK [Wait for instance(s) creation to complete] *******************************
     changed: [localhost] => (item=None)
     changed: [localhost]

     PLAY RECAP *********************************************************************
     localhost                  : ok=5    changed=4    unreachable=0    failed=0


 --> Scenario: 'default'
 --> Action: 'prepare'
 Skipping, prepare playbook not configured.
 --> Scenario: 'default'
 --> Action: 'converge'

     PLAY [Converge] ****************************************************************

     TASK [Gathering Facts] *********************************************************
     ok: [instance]

     TASK [example-role : Create 'example' user] ************************************
     changed: [instance]

     TASK [example-role : Install nginx] ********************************************
     changed: [instance]

     RUNNING HANDLER [example-role : Restart nginx] *********************************
     changed: [instance]

     PLAY RECAP *********************************************************************
     instance                   : ok=4    changed=3    unreachable=0    failed=0


 --> Scenario: 'default'
 --> Action: 'idempotence'
 Idempotence completed successfully.
 --> Scenario: 'default'
 --> Action: 'side_effect'
 Skipping, side effect playbook not configured.
 --> Scenario: 'default'
 --> Action: 'verify'
 --> Executing Testinfra tests found in /home/elijah/sandbox/test-roles/example-role/molecule/default/tests/...
     ============================= test session starts ==============================
     platform linux -- Python 3.7.1, pytest-4.1.0, py-1.7.0, pluggy-0.8.1
     rootdir: /home/elijah/sandbox/test-roles/example-role/molecule/default, inifile:
     plugins: testinfra-1.16.0
 collected 5 items

     tests/test_default.py .....                                              [100%]

     =============================== warnings summary ===============================

 ...

     ==================== 5 passed, 7 warnings in 27.37 seconds =====================
 Verifier completed successfully.
 --> Scenario: 'default'
 --> Action: 'destroy'

     PLAY [Destroy] *****************************************************************

     TASK [Destroy molecule instance(s)] ********************************************
     changed: [localhost] => (item=None)
     changed: [localhost]

     TASK [Wait for instance(s) deletion to complete] *******************************
     changed: [localhost] => (item=None)
     changed: [localhost]

     TASK [Delete docker network(s)] ************************************************

     PLAY RECAP *********************************************************************
     localhost                  : ok=2    changed=2    unreachable=0    failed=0
I have a few warning messages (that's likely because I am using python 3.7 and some of the libraries still don't fully support the new standards released with it) but all my tests passed.
Conclusion
Molecule is a great tool to test ansible roles quickly and while developing them. It also comes bundled with a bunch of other features from different projects that will test all aspects of your ansible code. I suggest you start using it when writing new ansible roles.
Container @container
DONE Linux Containers linux kernel docker podman dockerfile
Our story dates all the way back to 2006, believe it or not. The first steps were taken towards what we know today as containers. We'll discuss their history, how to build them and how to use them. Stick around! you might enjoy the ride.
History
2006-2007 - The Generic Process Containers lands in Linux
This was renamed thereafter to Control Groups, popularily known as cgroups, and landed in Linux version 2.6.24.
Cgroups are the first piece of the puzzle in Linux Containers. We will be talking about cgroups in detail later.
2008 - Namespaces
Even though namespaces have been around since 2002, Linux version 2.4.19, they saw a rapid development beginning 2006 and into 2008.
namespaces are the other piece of the puzzle in Linux Containers. We will talk about namespaces in more details later.
2008 - LXC
LXC finally shows up!
LXC is the first form of containers on the Linux kernel. LXC combined both cgroups and namespaces to provide isolated environments; containers.
Note
It is worth mentioning that LXC runs a full operating system containers from an image. In other words, LXC containers are meant to run more than one process.
2013 - Docker
Docker offered a full set of tools for working with containers, making it easier than ever to work with them.
Docker containers are designed to only run the application process.
Unlike LXC, the PID 1 of a Docker container is excepted to be the application running in the contanier.
We will be discussing this topic in more detail later.
Concepts
cgroups
Let's find out ! Better yet, let's use the tools at our disposal to find out together…
Open a terminal and run the following command.
man 7 cgroups
This should open the man pages for cgroups.
Control groups, usually referred to as cgroups, are a Linux kernel feature which allow processes to be organized into hierarchical groups whose usage of various types of resources can then be limited and monitored. The kernel's cgroup interface is provided through a pseudo-filesystem called cgroupfs. Grouping is implemented in the core cgroup kernel code, while resource tracking and limits are implemented in a set of per-resource-type subsystems (memory, CPU, and so on).
This can all be simplified by explaining it in a different way.
Essentially, you can think of cgroups as a way for the kernel to limit what you can use.
This gives us the ability to give a container only 1 CPU out of the 4 available to the kernel. Or maybe, limit the memory allowed to 512MB to the container. This way the container cannot overload the resources of the system in case they run a fork-bomb, for example.
But, cgroups do not limit what we can "see".
namespaces
As we did before, let's check the man page for namespaces
man 7 namespacesA namespace wraps a global system resource in an abstraction that makes it appear to the processes within the namespace that they have their own isolated instance of the global resource. Changes to the global resource are visible to other processes that are members of the namespace, but are invisible to other processes. One use of namespaces is to implement containers.
Wooow ! That's more mumbo jumbo ?!
Let's simplify this one as well.
You can think of namespaces as a way for the kernel to limit what we see.
There are multiple namespaces, like the cgroup_namespaces which virtualizes the view of a process cgroup.
In other words, inside the cgroup the process with PID 1 is not PID on the system.
The namespaces manual page lists them, you check them out for more details. But I hope you get the gist of it !
Linux Containers
We are finally here! Let's talk Linux Containers.
The first topic we need to know about is images.
We talked before that Docker came in and offered tooling around containers.
One of those concepts which they used, in docker images, is layers.
First of all, an image is a file-system representation of a container. It is an on-disk, read-only, image. It sort of looks like your Linux filesystem.
Then, layers on top to add functionality. You might ask, what are these layers. We will see them in action.
Let's look at my system.
lsb_release -aLSB Version: n/a Distributor ID: ManjaroLinux Description: Manjaro Linux Release: 20.2.1 Codename: Nibia
As you can see, I am running Manjaro. Keep that in mind.
Let's take a look at the kernel running on this machine.
uname -aLinux manjaro 5.10.15-1-MANJARO #1 SMP PREEMPT Wed Feb 10 10:42:47 UTC 2021 x86_64 GNU/Linux
So, it's kernel version 5.8.6. Remember this one as well.
I would like to test a tool called neofetch. Why ?
- First reason, I am not that creative.
- Second, it's a nice tool, you'll see.
We can test neofetch
neofetchfish: Unknown command: neofetch
Look at that! We don't have it installed… Not a big deal. We can download an image and test it inside.
Let's download a docker image. I am using podman, an open source project that allows us to use containers.
Note
You might want to run these commands with sudo privileges.
podman pull ubuntu:20.04f63181f19b2fe819156dcb068b3b5bc036820bec7014c5f77277cfa341d4cb5e
Let's pull an Ubuntu image.
As you can see, we have pulled an image from the repositories online. We can see further information about the image.
podman imagesREPOSITORY TAG IMAGE ID CREATED SIZE docker.io/library/ubuntu 20.04 f63181f19b2f 5 weeks ago 75.3 MB
Much better, now we can see that we have an Ubuntu image downloaded from docker.io.
A container is nothing more than an instance of an image. It is the running instance of an image.
Let's list our containers.
podman ps -aCONTAINER ID IMAGE COMMAND CREATED STATUS PORTS NAMES
We have none. Let's start one.
podman run -it ubuntu:20.04 uname -aLinux 57453b419a43 5.10.15-1-MANJARO #1 SMP PREEMPT Wed Feb 10 10:42:47 UTC 2021 x86_64 x86_64 x86_64 GNU/Linux
It's running the same kernel as our machine… Are we really inside a container ?
podman run -it ubuntu:20.04 hostname -f6795b85eeb50
okay ?! And our hostname is ?
hostname -fmanjaro
Hmm… They have different hostnames…
Let's see if it's really Ubuntu.
podman run -it ubuntu:20.04 bash -c 'apt-get update && apt-get install -y vim'Get:1 http://archive.ubuntu.com/ubuntu focal InRelease [265 kB] Get:2 http://archive.ubuntu.com/ubuntu focal-updates InRelease [114 kB] Get:3 http://archive.ubuntu.com/ubuntu focal-backports InRelease [101 kB] Get:4 http://security.ubuntu.com/ubuntu focal-security InRelease [109 kB] Get:5 http://archive.ubuntu.com/ubuntu focal/restricted amd64 Packages [33.4 kB] Get:6 http://archive.ubuntu.com/ubuntu focal/multiverse amd64 Packages [177 kB] Get:7 http://archive.ubuntu.com/ubuntu focal/universe amd64 Packages [11.3 MB] ... Setting up libpython3.8:amd64 (3.8.5-1~20.04.2) ... Setting up vim (2:8.1.2269-1ubuntu5) ... update-alternatives: using /usr/bin/vim.basic to provide /usr/bin/vim (vim) in auto mode update-alternatives: using /usr/bin/vim.basic to provide /usr/bin/vimdiff (vimdiff) in auto mode update-alternatives: using /usr/bin/vim.basic to provide /usr/bin/rvim (rvim) in auto mode update-alternatives: using /usr/bin/vim.basic to provide /usr/bin/rview (rview) in auto mode update-alternatives: using /usr/bin/vim.basic to provide /usr/bin/vi (vi) in auto mode ... update-alternatives: using /usr/bin/vim.basic to provide /usr/bin/editor (editor) in auto mode ... Processing triggers for libc-bin (2.31-0ubuntu9.1) ...
This should not work on my Manjaro. apt-get is not a thing here.
Well, the output is a bit large so I truncated it a bit for readability but we seem to have installed vim successfully.
Now that we saw what an image is and what a container is. We can explore a bit inside a container to see it more clearly.
So, what can we do with containers? We can use the layering system and the docker created tooling to create them and distribute them.
Let's go back to our neofetch example.
I want to get an Ubuntu image, then install neofetch on it.
First step, create a Dockerfile in your current directory. It should look like this.
FROM ubuntu:20.04

RUN apt-get update && \
    apt-get install -y neofetch
This file has two commands:
FROMdesignates the base image to use. This is the base image we will be building upon. In our case, we choseUbuntu:20.04. You can find the images on multiple platforms. To mention a few, we have Dockerhub, Quay.io and a few others. By default, this downloads from Dockerhub.RUNdesignates the commands to run. Pretty simple. We are running a couple of commands that should be very familiar to any user familiar with debian-based OS's.
Now that we have a Dockerfile, we can build the container.
podman build -t neofetch-ubuntu:20.04 -f Dockerfile.ubuntu .STEP 1: FROM ubuntu:20.04 STEP 2: RUN apt-get update && apt-get install -y neofetch Get:1 http://archive.ubuntu.com/ubuntu focal InRelease [265 kB] Get:2 http://security.ubuntu.com/ubuntu focal-security InRelease [109 kB] Get:3 http://archive.ubuntu.com/ubuntu focal-updates InRelease [114 kB] ... Fetched 17.2 MB in 2s (7860 kB/s) Reading package lists... ... The following additional packages will be installed: chafa dbus fontconfig-config fonts-dejavu-core fonts-droid-fallback fonts-noto-mono fonts-urw-base35 ghostscript gsfonts imagemagick-6-common krb5-locales libapparmor1 libavahi-client3 libavahi-common-data libavahi-common3 libbsd0 libchafa0 libcups2 libdbus-1-3 libexpat1 libfftw3-double3 libfontconfig1 libfreetype6 libglib2.0-0 libglib2.0-data libgomp1 libgs9 libgs9-common libgssapi-krb5-2 libicu66 libidn11 libijs-0.35 libjbig0 libjbig2dec0 libjpeg-turbo8 libjpeg8 libk5crypto3 libkeyutils1 libkrb5-3 libkrb5support0 liblcms2-2 liblqr-1-0 libltdl7 libmagickcore-6.q16-6 libmagickwand-6.q16-6 libopenjp2-7 libpaper-utils libpaper1 libpng16-16 libssl1.1 libtiff5 libwebp6 libwebpmux3 libx11-6 libx11-data libxau6 libxcb1 libxdmcp6 libxext6 libxml2 poppler-data shared-mime-info tzdata ucf xdg-user-dirs Suggested packages: default-dbus-session-bus | dbus-session-bus fonts-noto fonts-freefont-otf | fonts-freefont-ttf fonts-texgyre ghostscript-x cups-common libfftw3-bin libfftw3-dev krb5-doc krb5-user liblcms2-utils libmagickcore-6.q16-6-extra poppler-utils fonts-japanese-mincho | fonts-ipafont-mincho fonts-japanese-gothic | fonts-ipafont-gothic fonts-arphic-ukai fonts-arphic-uming fonts-nanum The following NEW packages will be installed: chafa dbus fontconfig-config fonts-dejavu-core fonts-droid-fallback fonts-noto-mono fonts-urw-base35 ghostscript gsfonts imagemagick-6-common krb5-locales libapparmor1 libavahi-client3 libavahi-common-data libavahi-common3 libbsd0 libchafa0 libcups2 libdbus-1-3 libexpat1 libfftw3-double3 libfontconfig1 libfreetype6 libglib2.0-0 libglib2.0-data libgomp1 libgs9 libgs9-common libgssapi-krb5-2 libicu66 libidn11 libijs-0.35 libjbig0 libjbig2dec0 libjpeg-turbo8 libjpeg8 libk5crypto3 libkeyutils1 libkrb5-3 libkrb5support0 liblcms2-2 liblqr-1-0 libltdl7 libmagickcore-6.q16-6 libmagickwand-6.q16-6 libopenjp2-7 libpaper-utils libpaper1 libpng16-16 libssl1.1 libtiff5 libwebp6 libwebpmux3 libx11-6 libx11-data libxau6 libxcb1 libxdmcp6 libxext6 libxml2 neofetch poppler-data shared-mime-info tzdata ucf xdg-user-dirs 0 upgraded, 66 newly installed, 0 to remove and 6 not upgraded. Need to get 36.2 MB of archives. After this operation, 136 MB of additional disk space will be used. Get:1 http://archive.ubuntu.com/ubuntu focal/main amd64 fonts-droid-fallback all 1:6.0.1r16-1.1 [1805 kB] ... Get:66 http://archive.ubuntu.com/ubuntu focal/universe amd64 neofetch all 7.0.0-1 [77.5 kB] Fetched 36.2 MB in 2s (22.1 MB/s) ... Setting up ghostscript (9.50~dfsg-5ubuntu4.2) ... Processing triggers for libc-bin (2.31-0ubuntu9.1) ... STEP 3: COMMIT neofetch-ubuntu:20.04 --> 6486fa42efe 6486fa42efe5df4f761f4062d4986b7ec60b14d9d99d92d2aff2c26da61d13af
Note
You might need sudo to run this command.
As you can see, we just successfully built the container. We also got a hash as a name for it.
If you were careful, I used the && command instead of using multiple RUN. You can use as many RUN commands ase you like.
But be careful, each one of those commands creates a layer. The more layers you create, the more time they require to download*/*upload.
It might not seem to be a lot of time to download a few extra layer on one system. But if we talk about container orchestration platforms, it makes a big difference there.
Let's examine the build a bit more and see what we got.
STEP 1: FROM ubuntu:20.04
STEP 2: RUN apt-get update &&     apt-get install -y neofetch
The first step was to download the base image so we could use it, then we added a layer which insatlled neofetch. If we list our images.
podman imagesREPOSITORY TAG IMAGE ID CREATED SIZE localhost/neofetch-ubuntu 20.04 6486fa42efe5 5 minutes ago 241 MB docker.io/library/ubuntu 20.04 f63181f19b2f 5 weeks ago 75.3 MB
We can see that we have localhost/neofetch-ubuntu. If we examine the ID, we can see that it is the same as the one given to us at the end of the build.
Now that we created a brand-spanking-new image, we can run it.
podman imagesREPOSITORY TAG IMAGE ID CREATED SIZE localhost/neofetch-ubuntu 20.04 6486fa42efe5 6 minutes ago 241 MB docker.io/library/ubuntu 20.04 f63181f19b2f 5 weeks ago 75.3 MB
First we list our images. Then we choose which one to run.
podman run -it neofetch-ubuntu:20.04 neofetch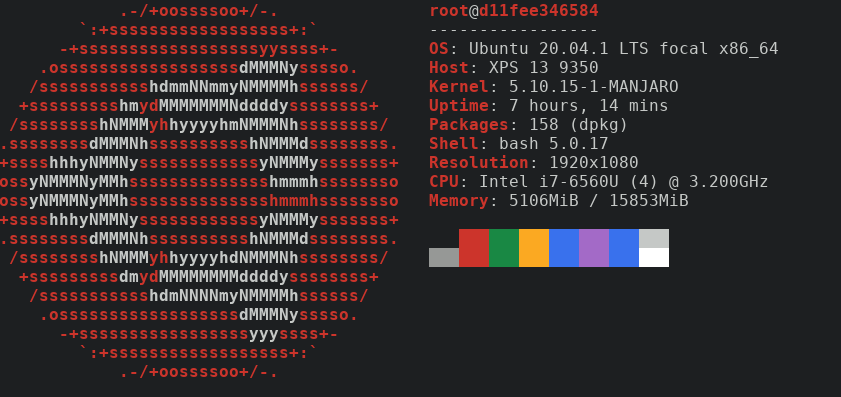
neofetch is installed in that container, because the image has it.
We can also build an image based on something else, maybe Fedora ?
I looked in Dockerhub (Fedora) and found the following image.
FROM fedora:32

RUN dnf install -y neofetch
We can duplicate what we did before real quick. Save file, run command to build the image.
podman build -t neofetch-fedora:20.04 -f Dockerfile.fedora .STEP 1: FROM fedora:32 STEP 2: RUN dnf install -y neofetch Fedora 32 openh264 (From Cisco) - x86_64 2.2 kB/s | 2.5 kB 00:01 Fedora Modular 32 - x86_64 4.1 MB/s | 4.9 MB 00:01 Fedora Modular 32 - x86_64 - Updates 4.9 MB/s | 4.4 MB 00:00 Fedora 32 - x86_64 - Updates 9.0 MB/s | 29 MB 00:03 Fedora 32 - x86_64 9.8 MB/s | 70 MB 00:07 Dependencies resolved. ======================================================================================== Package Arch Version Repo Size ======================================================================================== Installing: neofetch noarch 7.1.0-3.fc32 updates 90 k Installing dependencies: ImageMagick-libs x86_64 1:6.9.11.27-1.fc32 updates 2.3 M LibRaw x86_64 0.19.5-4.fc32 updates 320 k ... xorg-x11-utils x86_64 7.5-34.fc32 fedora 108 k Transaction Summary ======================================================================================== Install 183 Packages Total download size: 62 M Installed size: 203 M Downloading Packages: (1/183): LibRaw-0.19.5-4.fc32.x86_64.rpm 480 kB/s | 320 kB 00:00 ... xorg-x11-utils-7.5-34.fc32.x86_64 Complete! STEP 3: COMMIT neofetch-fedora:20.04 --> a5e57f6d5f1 a5e57f6d5f13075a105e02000e00589bab50d913900ee60399cd5a092ceca5a3
Then, run the container.
podman run -it neofetch-fedora:20.04 neofetch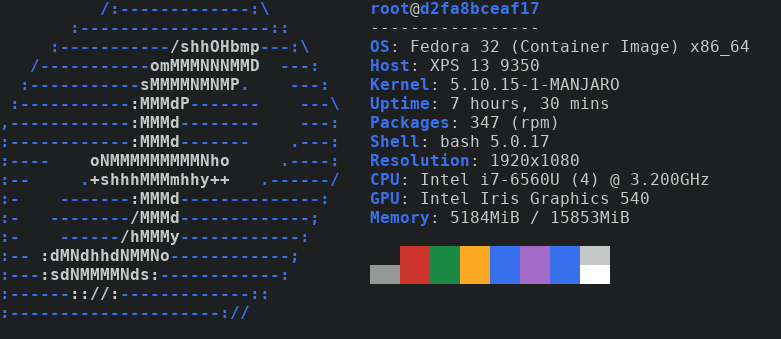
Conclusion
Finally thought before I let you go. You may have noticed that I used Podman instead of Docker. In these examples, both commands should be interchangeable.
Remember kids, containers are cool! They can be used for a wide variety of things. They are great at many things and with the help of container orchestration platforms, they can scale better than ever. They are also very bad at certain things. Be careful where to use them, how to use and when to use them. Stay safe and mainly have fun!
DONE Playing with containers and Tor docker linux @text_editors ubuntu fedora proxy privoxy
As my followers well know, by now, I am a tinkerer at heart. Why do I do things ? No one knows ! I don't even know.
All I know, all I can tell you is that I like to see what can I do with the tools I have at hand. How can I bend them to my will. Why, you may ask. The answer is a bit complicated; part of who I am, part of what I do as a DevOps. End line is, this time I was curious.
I went down a road that taught me so much more about containers, docker, docker-compose and even Linux itself.
The question I had was simple, can I run a container only through Tor running in another container?
Tor
I usually like to start topics that I haven't mentioned before with definitions. In this case, what is Tor, you may ask ?
Tor is free software and an open network that helps you defend against traffic analysis, a form of network surveillance that threatens personal freedom and privacy, confidential business activities and relationships, and state security.
Although that home page is obscure because it was replaced by the new design of the website. Although I love what Tor has done with all the services they offer, don't get me wrong. But giving so much importance on the browser only and leaving the rest for dead when it comes to website, I have to say, I'm a bit sad.
Anyway, let's share the love for Tor and thank them for the beautiful project they offered humanity.
Now that we thanked them, let's abuse it.
Tor in a container
The task I set to discover relied on Tor being containerized. The first thing I do is, simply, not re-invent the wheel. Let's find out if someone already took that task.
With a litte bit of search, I found the dperson/torproxy docker image. It isn't ideal but I believe it is written to be rebuilt.
Can we run it ?
docker run -it -p 127.0.0.1:8118:8118 -d dperson/torproxycurl -Lx http://localhost:8118 http://jsonip.com/And this is definitely not your IP. Don't take my word for it! Go to http://jsonip.com/ in a browser and see for yourself.
Now that we know we can run Tor in a container effectively, let's kick it up a notch.
docker-compose
I will be testing and making changes as I go along. For this reason, it's a good idea to use docker-compose to do this.
Compose is a tool for defining and running multi-container Docker applications. With Compose, you use a YAML file to configure your application’s services. Then, with a single command, you create and start all the services from your configuration.
Now that we saw what the docker team has to say about docker-compose, let's go ahead and use it.
First, let's implement what we just ran ad-hoc in docker-compose.
---
version: '3.9'
services:
  torproxy:
    image: dperson/torproxy
    container_name: torproxy
    restart: unless-stopped
Air-gapped container
The next piece of the puzzle is to figure out if and how can we create an air-gapped container.
It turns out, we can create an internal network in docker that has no access to the internet.
First, the air-gapped container.
  air-gapped:
    image: ubuntu
    container_name: air-gapped
    restart: unless-stopped
    command:
      - bash
      - -c
      - sleep infinity
    networks:
      - no-internet
Then comes the network.
networks:
  no-internet:
    driver: bridge
    internal: true
Let's put it all together in a docker-compose.yaml file and run it.
docker-compose up -dKeep that terminal open, and let's put the hypothesis to the test and see if rises up to be a theory.
docker exec air-gapped apt-get updateAaaaand…
Err:1 http://archive.ubuntu.com/ubuntu focal InRelease
  Temporary failure resolving 'archive.ubuntu.com'
Err:2 http://security.ubuntu.com/ubuntu focal-security InRelease
  Temporary failure resolving 'security.ubuntu.com'
Err:3 http://archive.ubuntu.com/ubuntu focal-updates InRelease
  Temporary failure resolving 'archive.ubuntu.com'
Err:4 http://archive.ubuntu.com/ubuntu focal-backports InRelease
  Temporary failure resolving 'archive.ubuntu.com'
Reading package lists...
W: Failed to fetch http://archive.ubuntu.com/ubuntu/dists/focal/InRelease  Temporary failure resolving 'archive.ubuntu.com'
W: Failed to fetch http://archive.ubuntu.com/ubuntu/dists/focal-updates/InRelease  Temporary failure resolving 'archive.ubuntu.com'
W: Failed to fetch http://archive.ubuntu.com/ubuntu/dists/focal-backports/InRelease  Temporary failure resolving 'archive.ubuntu.com'
W: Failed to fetch http://security.ubuntu.com/ubuntu/dists/focal-security/InRelease  Temporary failure resolving 'security.ubuntu.com'
W: Some index files failed to download. They have been ignored, or old ones used instead.
looks like it's real peeps, hooray !
Putting everything together
Okay, now let's put everything together. The list of changes we need to make are minimal. First, I will list them, then I will simply write them out in docker-compose.
- Create an
internetnetwork for the Tor container - Attach the
internetnetwork to the Tor container - Attach the
no-internetnetwork to the Tor container so that our air-gapped container can access it.
Let's get to work.
---
version: '3.9'
services:

  torproxy:
    image: dperson/torproxy
    container_name: torproxy
    restart: unless-stopped
    networks:
      - no-internet
      - internet

  air-gapped:
    image: ubuntu
    container_name: air-gapped
    restart: unless-stopped
    command:
      - bash
      - -c
      - sleep infinity
    networks:
      - no-internet

networks:
  no-internet:
    driver: bridge
    internal: true
  internet:
    driver: bridge
    internal: false
Run everything.
docker-compose up -dYes, this will run it in the background and there is no need for you to open another terminal. It's always good to know both ways. Anyway, let's test.
let's exec into the container.
docker exec -it air-gapped bash
Then we configure apt to use our torproxy service.
echo 'Acquire::http::Proxy "http://torproxy:8118/";' > /etc/apt/apt.conf.d/proxy
echo "export HTTP_PROXY=http://torproxy:8118/" >> ~/.bashrc
echo "export HTTPS_PROXY=http://torproxy:8118/" >> ~/.bashrc
export HTTP_PROXY=http://torproxy:8118/
export HTTPS_PROXY=http://torproxy:8118/
apt-get update
apt-get upgrade -y
DEBIAN_FRONTEND=noninteractive apt-get install -y curl
Harvesting the fruits of our labour
First, we always check if everything is set correctly.
While inside the container, we check the environment variables.
env | grep HTTPYou should see.
HTTPS_PROXY=http://torproxy:8118/
HTTP_PROXY=http://torproxy:8118/
Then, we curl our IP.
curl https://jsonip.com/And that is also not your IP.
It works !
Conclusion
Is it possible to route a container through another Tor container ?
The answer is obviously Yes and this is the way to do it. Enjoy.
DONE Let's play with Traefik docker linux traefik nginx ssl letsencrypt
I've been playing around with containers for a few years now. I find them very useful. If you host your own, like I do, you probably write a lot of nginx configurations, maybe apache.
If that's the case, then you have your own solution to get certificates. I'm also assuming that you are using let's encrypt with certbot or something.
Well, I didn't want to anymore. It was time to consolidate. Here comes Traefik.
Traefik
So Traefik is
an open-source Edge Router that makes publishing your services a fun and easy experience. It receives requests on behalf of your system and finds out which components are responsible for handling them.
Which made me realize, I still need nginx somewhere. We'll see when we get to it. Let's focus on Traefik.
Configuration
If you run a lot of containers and manage them, then you probably use docker-compose.
I'm still using version 2.3, I know I am due to an upgrade but I'm working on it slowly.
It's a bigger project… One step at a time.
Let's start from the top, literally.
---
version: '2.3'

services:
Note
Upgrading to version 3.x of docker-compose requires the creation of network to link containers together. It's worth investing into, this is not a docker-compose tutorial.
Then comes the service.
traefik:
  container_name: traefik
  image: "traefik:latest"
  restart: unless-stopped
  mem_limit: 40m
  mem_reservation: 25m
and of course, who can forget the volume mounting.
volumes:
  - "/var/run/docker.sock:/var/run/docker.sock:ro"
Design
Now let's talk design to see how we're going to configuse this bad boy.
I want to Traefik to listen on ports 80 and 443 at a minimum to serve traffic.
Let's do that.
command:
  - --entrypoints.web.address=:80
  - --entrypoints.websecure.address=:443
and let's not forget to map them.
ports:
  - "80:80"
  - "443:443"
Next, we would like to redirect http to https always.
- --entrypoints.web.http.redirections.entryPoint.to=websecure
- --entrypoints.web.http.redirections.entryPoint.scheme=https
We are using docker, so let's configure that as the provider.
- --providers.dockerWe can set the log level.
- --log.level=INFOIf you want a dashboard, you have to enable it.
- --api.dashboard=trueAnd finally, if you're using Prometheus to scrape metrics… You have to enable that too.
- --metrics.prometheus=trueLet's Encrypt
Let's talk TLS. You want to serve encrypted traffic to users. You will need an SSL Certificate.
Your best bet is open source. Who are we kidding, you'd want to go with let's encrypt.
Let's configure acme to do just that. Get us certificates. In this example, we are going to be using Cloudflare.
- --certificatesresolvers.cloudflareresolver.acme.email=<your@email.here>
- --certificatesresolvers.cloudflareresolver.acme.dnschallenge.provider=cloudflare
- --certificatesresolvers.cloudflareresolver.acme.storage=./acme.json
Warning
Let's Encrypt have set limits on how many certificates you can request per certain amount of time. To test your certificate request and renewal processes, use their staging infrastructure. It is made for such purpose.
Then we mount it, for persistence.
- "./traefik/acme.json:/acme.json"Let's not forget to add our Cloudflare API credentials as environment variables for Traefik to use.
environment:
  - CLOUDFLARE_EMAIL=<your-cloudflare@email.here>
  - CLOUDFLARE_API_KEY=<your-api-key-goes-here>
Dashboard
Now let's configure Traefik a bit more with a bit of labeling.
First, we specify the host Traefik should listen for to service the dashboard.
labels:
  - "traefik.http.routers.dashboard-api.rule=Host(`dashboard.your-host.here`)"
  - "traefik.http.routers.dashboard-api.service=api@internal"
With a little bit of Traefik documentation searching and a lot of help from htpasswd, we can create a basicauth login to protect the dashboard from public use.
- "traefik.http.routers.dashboard-api.middlewares=dashboard-auth-user"
- "traefik.http.middlewares.dashboard-auth-user.basicauth.users=<user>:$$pws5$$rWsEfeUw9$$uV45uwsGeaPbu8RSexB9/"
- "traefik.http.routers.dashboard-api.tls.certresolver=cloudflareresolver"
Middleware
I'm not going to go into details about the middleware flags configured here but you're welcome to check the Traefik middleware docs.
- "traefik.http.middlewares.frame-deny.headers.framedeny=true"
- "traefik.http.middlewares.browser-xss-filter.headers.browserxssfilter=true"
- "traefik.http.middlewares.ssl-redirect.headers.sslredirect=true"
Full Configuration
Let's put everything together now.
<<docker-compose-service-traefik>>
  <<docker-compose-traefik-port-mapping>>
  <<docker-compose-traefik-config-listeners>>
    <<docker-compose-traefik-config-https-redirect>>
    <<docker-compose-traefik-config-provider>>
    <<docker-compose-traefik-config-log-level>>
    <<docker-compose-traefik-config-dashboard>>
    <<docker-compose-traefik-config-prometheus>>
    <<docker-compose-traefik-config-acme>>
  <<docker-compose-traefik-volumes>>
    <<docker-compose-traefik-volumes-acme>>
  <<docker-compose-traefik-environment>>
  <<docker-compose-traefik-labels>>
    <<docker-compose-traefik-labels-basicauth>>
    <<docker-compose-traefik-config-middleware>>
nginx
nginx pronounced
[engine x] is an HTTP and reverse proxy server, a mail proxy server, and a generic TCP/UDP proxy server, originally written by Igor Sysoev.
In this example, we're going to assume you have a static blog generated by a static blog generator of your choice and you would like to serve it for people to read it.
So let's do this quickly as there isn't much to tell except when it comes to labels.
nginx:
  container_name: nginx
  image: nginxinc/nginx-unprivileged:alpine
  restart: unless-stopped
  mem_limit: 8m
  command: ["nginx", "-enable-prometheus-metrics", "-g", "daemon off;"]
  volumes:
    - "./blog/:/usr/share/nginx/html/blog:ro"
    - "./nginx/default.conf.template:/etc/nginx/templates/default.conf.template:ro"
  environment:
    - NGINX_BLOG_PORT=80
    - NGINX_BLOG_HOST=<blog.your-host.here>
We are mounting the blog directory from our host to /usr/share/nginx/html/blog as read-only into the nginx container. We are also providing nginx with a template configuration and passing the variables as environment variables as you noticed. It is also mounted as read-only. The configuration template looks like the following, if you're wondering.
server {

    listen       ${NGINX_BLOG_PORT};
    server_name  localhost;

    root   /usr/share/nginx/html/${NGINX_BLOG_HOST};

    location / {
        index  index.html;
        try_files $uri $uri/ =404;
    }
}
Traefik configuration
So, Traefik configuration at this point is a little bit tricky for the first time.
First, we configure the host like we did before.
labels:
  - "traefik.http.routers.blog-http.rule=Host(`blog.your-host.here`)"
We tell Traefik about our service and the port to loadbalance on.
- "traefik.http.routers.blog-http.service=blog-http"
- "traefik.http.services.blog-http.loadbalancer.server.port=80"
We configure the middleware to use configuration defined in the Traefik middleware configuration section.
- "traefik.http.routers.blog-http.middlewares=blog-main"
- "traefik.http.middlewares.blog-main.chain.middlewares=frame-deny,browser-xss-filter,ssl-redirect"
Finally, we tell it about our resolver to generate an SSL Certificate.
- "traefik.http.routers.blog-http.tls.certresolver=cloudflareresolver"Full Configuration
Let's put the nginx service together.
<<docker-compose-service-nginx>>
  <<docker-compose-nginx-labels>>
    <<docker-compose-nginx-labels-service>>
    <<docker-compose-nginx-labels-middleware>>
    <<docker-compose-nginx-labels-tls>>
Finale
It's finally time to put everything together !
<<docker-compose-header>>

  <<docker-compose-traefik>>

  <<docker-compose-nginx>>
Now we're all set to save it in a docker-compose.yaml file and
docker-compose up -dIf everything is configured correctly, your blog should pop-up momentarily. Enjoy !
DONE Time to deploy our static blog docker dockerfile linux traefik nginx ssl letsencrypt
In the previous post, entitled "#let-s-play-with-traefik", we deployed Traefik and configured it. We left it in a running state but we haven't really used it properly yet.
Let's put it to some good use this time around.
Pre-requisites
This blog post assumes that you already have a generated static website or blog. There are multiple tools in the sphere which allows you to statically generate your blog.
You can find a list of them on the Awesome Static Web Site Generators.
Once we have the directory on disk, we can move forward.
Components
Let's talk components a tiny bit and see what we have and what we need. We already a static site. We can expose our site using Traefik. We can also generate an SSL certificate for the exposed site.
What we don't have, is a way to serve our static site. Traefik is only a reverse proxy server. A reverse proxy, sort of, routes into and out of sockets. These sockets could be open local ports, or they could, also, be other containers.
Nginx
That's where nginx comes into the picture.
nginx [engine x] is an HTTP and reverse proxy server, a mail proxy server, and a generic TCP/UDP proxy server, originally written by Igor Sysoev.
We can find an nginx docker image on dockerhub. But, if we look around carefully we can see a section that mentions "running nginx as a non-root user". This led me to a small discovery which made me look for an alternative of that image.
Luckily for us, nginxinc also releases an unprivileged version of that image under the name of nginx-unprivileged.
Configuration
The nginx docker image can be configured using a template configuration file which can be mounted into the container.
The configuration can include variables which will be replaced by environment variables we inject into the container.
Let's look at an example configuration default.conf.template.
server {

    listen       ${NGINX_BLOG_PORT};
    server_name  localhost;

    root   /usr/share/nginx/html/${NGINX_BLOG_HOST};

    location / {
        index  index.html;

        try_files $uri $uri/ =404;
    }
}
In the example above, we use NGINX_BLOG_HOST and NGINX_BLOG_PORT as
environment variables to be replaced in the nginx configuration.
Container
After creating our nginx configuration, we need to run an nginx container and serve our blog to the users.
In the previous post, we used docker-compose to deploy Traefik. We will continue with that and deploy our nginx container alongside.
docker-compose
Before we go ahead and create another service in the docker-compose file, let's talk a bit about what we need.
We need to deploy an unprivileged nginx container, first and foremost. We need to inject a few environment variables into the container to be included in the nginx templated configuration. We, also, need not forget to include the labels required for Traefik to route our container properly, and generate an SSL certificate. Finally, we need to mount both the nginx configuration template and, of course, our static blog.
Now let's head to work.
  nginx:
    container_name: nginx
    image: nginxinc/nginx-unprivileged:alpine
    restart: unless-stopped
    mem_limit: 8m
    command: ["nginx", "daemon off;"]
    volumes:
      - "./blog/static/:/usr/share/nginx/html/blog:ro"
      - "./blog/nginx/default.conf.template:/etc/nginx/templates/default.conf.template:ro"
    environment:
      - NGINX_BLOG_PORT=80
      - NGINX_BLOG_HOST=blog.example.com
    labels:
      - "traefik.http.routers.blog-http.rule=Host(`blog.example.com`)"
      - "traefik.http.routers.blog-http.service=blog-http"
      - "traefik.http.services.blog-http.loadbalancer.server.port=80"
      - "traefik.http.routers.blog-http.middlewares=blog-main"
      - "traefik.http.middlewares.blog-main.chain.middlewares=frame-deny,browser-xss-filter,ssl-redirect"
      - "traefik.http.middlewares.frame-deny.headers.framedeny=true"
      - "traefik.http.middlewares.browser-xss-filter.headers.browserxssfilter=true"
      - "traefik.http.middlewares.ssl-redirect.headers.sslredirect=true"
      - "traefik.http.routers.blog-http.tls.certresolver=cloudflareresolver"
If we look at the Traefik configuration we can see the following important configurations.
-
traefik.http.routers.blog-http.rule - This configures the
hostnameTraefik should be listening on for our nginx container. -
traefik.http.routers.blog-http.service - This configures the router to use our service.
-
traefik.http.services.blog-http.loadbalancer.server.port - We configure the
service
port. -
traefik.http.routers.blog-http.middlewares - We configure the router to
use our
middleware. -
traefik.http.middlewares.blog-main.chain.middlewares - We configure all the
middlewarechain. -
traefik.http.middlewares.ssl-redirect.headers.sslredirect - We always
redirect
httptohttps. -
traefik.http.routers.blog-http.tls.certresolver - We configure the
resolver to use to generate our SSL certificate.
We can also see our static blog and the nginx template being mounted as
read-only inside the container to their right paths. Finally, we verify that
our
NGINX_BLOG_HOSTandNGINX_BLOG_PORTare configured correctly.
Final steps
After putting everything in place, we do a quick last check that everything is correctly in place. Once we are satisfied with the results, we run !
docker-compose up -dAnd we're good to go.
If we point our /etc/hosts to our site, we can test that everything works.
192.168.0.1 blog.example.comNote
Replace 192.168.0.1 with your public server's IP address. This is an example
of an IP unroutable on the internet.
If everything is configured properly, we should see our site pop up momentarily. The SSL certificate will fail for a few minutes until Traefik is able to generate a new one and serve it. Give it some time.
Once everything up and running, you can enjoy your blog being served by Traefik through an nginx container.
Conclusion
You can serve your static blog with Traefik and nginx easily. Make sure to take the necessary measures to run container safely and it should be easy as pie.
Traefik makes it possible to route to multiple containers this way, allowing us to add more services to the docker-compose file. At the same time, nginx, with the templating feature, offers us another flexible way to serve a big variety of static sites. Using them in combination open a wide range of possibilities.
DONE Raspberry Pi, Container Orchestration and Swarm right at home docker linux arm ansible swarm raspberry_pi
When I started looking into solutions for my home container orchestration, I wanted a solution that runs on my 2 Raspberry Pis. These beasts have 4 virtual CPUs and a whoping 1GB of memory each. In other words, not a lot of resources to go around. What can I run on these? I wonder!
Consideration
If we look at the state of container orchestration today, we see that Kubernetes domates the space. Kubernetes is awesome, but will it run on my Pis ? I doubt it.
Fret not ! There are other, more lightweight, solutions out there. Let's discuss them briefly.
K3s
I have experience with K3s. I even wrote a blog post on it. Unfortunately, I found that K3s uses almost half of the memory resources of the Pis to run. That's too much overhead lost.
MicroK8s
MicroK8s is a Canonical project. It has similarities to K3s in the way of easy deployment and lightweight focus. The end result is also extremly similar to K3s in resource usage.
Nomad
Nomad is a HashiCorp product and just all their other products, it is very well designed, very robust and extremly versatile. Running it on the Pis was a breeze, it barely used any resources.
It shoulds great so far, doesn't it ? Well, sort of. The deployment and configuration of Nomad is a bit tricky and requires a bit of moving components. Those can be automated with Ansible eventually. Aside that, Nomad requires extra configuration to install and enable CNI and service discovery.
Finally, it has a steep learning curve to deploy containers in the cluster and you have HCL to deal with.
Swarm
I was surprised to find that not only Docker Swarm is still alive, it also became a mode which comes preshipped with docker since a few years ago.
I also found out that Swarm has great Ansible integration, for both initializing and creating the cluster and deploying stacks and services into it. After all, if you are already familiar with docker-compose, you'll feel right at home.
Setting up a Swarm cluster
I set up to deploy my Swarm Cluster and manage it using Ansible. I didn't want to do the work again in the future and I wanted to go the IaC (Infrastructure as Code) route, as should you.
At this stage, I have to take a few assumptions. I assume that you already have
at least 2 machines with a Linux Distribution installed on them. I, also, assume
that docker is already installed and running on both machines. Finally, all
the dependencies required to run Ansible on both hosts (python3-docker and
python3-jsondiff on Ubuntu).
There are two types of nodes in a Swarm cluster; manager and worker.
The first node used to initialize the cluster is the leader node which is
also a manager node.
Leader
For the leader node, our tasks are going to be initializing the cluster.
Before we do so, let's create our quick and dirty Ansible inventory file.
---
all:
  hosts:
  children:
    leader:
      hosts:
        node001:
          ansible_host: 192.168.0.100
          ansible_user: user
          ansible_port: 22
          ansible_become: yes
          ansible_become_method: sudo
    manager:
    worker:
      hosts:
        node002:
          ansible_host: 192.168.0.101
          ansible_user: user
          ansible_port: 22
          ansible_become: yes
          ansible_become_method: sudo
warning
This isn't meant to be deployed in production in a professional setting. It
goes without saying, the leader is static, not highly available and prone to
failure. The manager and worker node tasks are, also, dependent on the
successful run of the initialization task on the leader.
Now that we've taken care of categorizing the nodes and writing the Ansible
inventory, let's initialize a Swarm cluster.
---
- name: Init a new swarm cluster
  community.docker.docker_swarm:
    state: present
    advertise_addr: "{{ hostvars[inventory_hostname]['ansible_default_ipv4']['address'] }}"
  register: clustering_swarm_cluster
Note
We use hostvars[inventory_hostname]['ansible_default_ipv4']['address'] which
returns the IP address of the node itself. This is the IP adress used to advertise.
Note
We use register to save the returned response from the cluster initialization
into a new variable we called clustering_swarm_cluster. This will come handy later.
This should take care of initializing a new Swarm cluster.
You can verify if Swarm is running.
$ docker system info 2>&1 | grep Swarm
Swarm: active
Manager
If you have a larger number of nodes, you might require more than one manager
node. To join more managers to the cluster, we can use the power of Ansible again.
---
- name: Add manager node to Swarm cluster
  community.docker.docker_swarm:
    state: join
    advertise_addr: "{{ hostvars[inventory_hostname]['ansible_default_ipv4']['address'] }}"
    join_token: "{{ hostvars[groups['leader'][0]]['clustering_swarm_cluster']['swarm_facts']['JoinTokens']['Manager'] }}"
    remote_addrs: [ "{{ hostvars[groups['leader'][0]]['ansible_default_ipv4']['address'] }}:2377" ]
Note
We access the token we saved earlier on the leader to join a manager to the cluster using hostvars[groups['leader'][0]]['clustering_swarm_cluster']['swarm_facts']['JoinTokens']['Manager'].
Note
If we can get a hostvar from a different node, we can also get the IP of such
node with hostvars[groups['leader'][0]]['ansible_default_ipv4']['address'].
Now that we've taken care of the manager code, let's work on the worker nodes.
Worker
Just as easily as we created the task to join a manager node to the cluster,
we do the same for the worker.
---
- name: Add worker node to Swarm cluster
  community.docker.docker_swarm:
    state: join
    advertise_addr: "{{ hostvars[inventory_hostname]['ansible_default_ipv4']['address'] }}"
    join_token: "{{ hostvars[groups['leader'][0]]['clustering_swarm_cluster']['swarm_facts']['JoinTokens']['Worker'] }}"
    remote_addrs: [ "{{ hostvars[groups['leader'][0]]['ansible_default_ipv4']['address'] }}:2377" ]
Note
Déjà vu when it comes to the join_token, except that we use the worker token instead.
The glue code you're looking for that does the magic is this.
---
- name: Bootstrap Swarm depedencies
  include_tasks: common.yml

- name: Bootstrap leader node
  include_tasks: leader.yml
  when: inventory_hostname in groups['leader']

- name: Bootstrap manager node
  include_tasks: manager.yml
  when: inventory_hostname in groups['manager']

- name: Bootstrap worker node
  include_tasks: worker.yml
  when: inventory_hostname in groups['worker']
Each of the tasks described above should be in its own file, as shown in the glue code, and they will only run on the group they are meant to run on.
Following these tasks, I ended up with the cluster below.
# docker node ls
ID                            HOSTNAME   STATUS    AVAILABILITY   MANAGER STATUS   ENGINE VERSION
h4scu4nry2r9p129rsdt88ae2 *   node001    Ready     Active         Leader           20.10.17
uyn43a9tsdn2n435untva9pae     node002    Ready     Active                          20.10.17
There, we see both nodes and they both seem to be in a Ready state.
Conclusion
If you're outside a professional setting and you find yourself needing to run a container orchestration platform, some platforms might be overkill. Docker Swarm has great community support in Ansible making the management of small clusters on low resource devices extremly easy. It comes with the added bonus of having built-in service discovery and networking. Give it a try, you might be pleasently surprised like I was.
DONE Deploying Traefik and Pihole on the Swarm home cluster docker linux arm ansible traefik pihole swarm raspberry_pi
In the previous post, we setup a Swarm cluster. That's fine and dandy but that cluster, as far as we're concerned, is useless. Let's change that.
Traefik
I've talked and played with Traefik previously on this blog and here we go
again, with another orchestration technology. As always, we need an ingress to
our cluster. Traefik makes a great ingress that's easily configurable with labels.
Let's not forget, we're working with Swarm this time around. Swarm stacks
look very similar to docker-compose manifests.
But, before we do that, there is a small piece of information that we need to be aware of. For Traefik to be able to route traffic to our services, both Traefik and the service need to be on the same network. Let's make this a bit more predictable and manage that network ourselves.
warning
Only leader and manager nodes will allow interaction with the Swarm
cluster. The worker nodes will not give you any useful information about the
cluster.
Network Configuration
We started with Ansible and we shall continue with Ansible. We begin with creating the network.
---
- name: Create a Traefik Ingress network
  community.docker.docker_network:
    name: traefik-ingress
    driver: overlay
    scope: swarm
Ingress
Once the network is in place, we can go ahead and deploy Traefik.
warning
This setup is not meant to be deploy in a production setting. SSL certificates require extra configuration steps that might come in a future post.
---
- name: Deploy Traefik Stack
  community.docker.docker_stack:
    state: present
    name: Traefik
    compose:
      - version: '3'
        services:
          traefik:
            image: traefik:latest
            restart: unless-stopped
            command:
              - --entrypoints.web.address=:80
              - --providers.docker=true
              - --providers.docker.swarmMode=true
              - --accesslog
              - --log.level=INFO
              - --api
              - --api.insecure=true
            ports:
              - "80:80"
            volumes:
              - "/var/run/docker.sock:/var/run/docker.sock:ro"
            networks:
            - traefik-ingress
            deploy:
              replicas: 1
              resources:
                limits:
                  cpus: '1'
                  memory: 80M
                reservations:
                  cpus: '0.5'
                  memory: 40M
              placement:
                constraints:
                  - node.role == manager

              labels:
                - traefik.protocol=http
                - traefik.docker.network=traefik-ingress
                - traefik.http.routers.traefik-api.rule=Host(`traefik.our-domain.com`)
                - traefik.http.routers.traefik-api.service=api@internal
                - traefik.http.services.taefik-api.loadbalancer.server.port=8080

        networks:
          traefik-ingress:
            external: true
Note
Even though these are Ansible tasks, Swarm stack manifests are not much different as I'm using mostly the raw format.
Let's talk a bit about what we did.
-
--providers.docker=trueand--providers.docker.swarmMode=true - We configure Traefik to enable both docker and swarm mode providers.
-
--apiand--api-insecure=true - We enable the API which offers the UI and we allow it to run insecure.
The rest, I believe, have been explained in the previous blog post.
If everything went well, and we configured our DNS properly, we should be
welcomed by a Traefik dashboard on traefik.our-domain.com.
Pi-hole
Now I know most people install the Pi-hole straight on the Pi. Well, I'm not most people and I'd like to deploy it in a container. I feel it's easier all around than installing it on the system, you'll see.
---
- name: Deploy PiHole Stack
  community.docker.docker_stack:
    state: present
    name: PiHole
    compose:
      - version: '3'
        services:
          pihole:
            image: pihole/pihole:latest
            restart: unless-stopped
            ports:
              - "53:53"
              - "53:53/udp"
            cap_add:
              - NET_ADMIN
            environment:
              TZ: "Europe/Vienna"
              VIRTUAL_HOST: pihole.our-domain.com
              VIRTUAL_PORT: 80
            healthcheck:
              test: ["CMD", "curl", "-f", "http://localhost:80/"]
              interval: 30s
              timeout: 20s
              retries: 3
            volumes:
              - /opt/pihole/data/pihole-config:/etc/pihole
              - /opt/pihole/data/pihole-dnsmasq.d:/etc/dnsmasq.d
            networks:
              - traefik-ingress
            deploy:
              replicas: 1
              placement:
                constraints:
                  - node.role == worker
              labels:
                - traefik.docker.network=traefik-ingress
                - traefik.http.routers.pihole-http.entrypoints=web
                - traefik.http.routers.pihole-http.rule=Host(`pihole.our-domain.com`)
                - traefik.http.routers.pihole-http.service=pihole-http
                - traefik.http.services.pihole-http.loadbalancer.server.port=80
                - traefik.http.routers.pihole-http.middlewares=pihole-main
                - traefik.http.middlewares.pihole-main.chain.middlewares=frame-deny,browser-xss-filter
                - traefik.http.middlewares.frame-deny.headers.framedeny=true
                - traefik.http.middlewares.browser-xss-filter.headers.browserxssfilter=true

        networks:
          traefik-ingress:
            external: true
We make sure to expose port 53 for DNS on all nodes, and configure the
proper labels to our service so that Traefik can pick it up.
Once deployed and your DNS is pointing properly then pihole.our-domain.com
is waiting for you. This also shows us that the networking between nodes works
properly. Let's test it out.
$ nslookup duckduckgo.com pihole.our-domain.com
Server:		pihole.our-domain.com
Address:	192.168.1.100#53

Non-authoritative answer:
Name:	duckduckgo.com
Address: 52.142.124.215
Alright, seems that our Pi-hole works.
Conclusion
On these small Raspberry Pis, the cluster seems to be working very well. The Pi-hole has been running without any issues for a few days running my internal DNS. There's a few improvements that can be done to this setup, mainly the deployment of an SSL cert. That may come in the future, time permitting. Stay safe, until the next one !
K3s @k3s
DONE Building k3s on a Pi arm kubernetes
I have had a Pi laying around used for a simple task for a while now. A few days ago, I was browsing the web, learning more about privacy, when I stumbled upon AdGuard Home.
I have been using it as my internal DNS on top of the security and privacy layers I add to my machine. Its benefits can be argued but it is a DNS after all and I wanted to see what else it can do for me. Anyway, I digress. I searched to see if I could find a container for AdGuard Home and I did.
At this point, I started thinking about what I could do to make the Pi more useful.
That's when k3s came into the picture.
Pre-requisites
As this is not a Pi tutorial, I am going to be assuming that you have a Raspberry Pi with Raspberry Pi OS Buster installed on it. The assumption does not mean you cannot install any other OS on the Pi and run this setup. It only means that I have tested this on Buster and that your milage will vary.
Prepare the Pi
Now that you have Buster already installed, let's go ahead and fix a small default configuration issue with it.
K3s uses iptables to route things around correctly. Buster uses nftables by default, let's switch it to iptables.
 $ sudo iptables -F
 $ sudo update-alternatives --set iptables /usr/sbin/iptables-legacy
 $ sudo update-alternatives --set ip6tables /usr/sbin/ip6tables-legacy
 $ sudo reboot
At this point, your Pi should reboot. Your OS is configured for the next step.
Pre-install Configuration
After testing k3s a few times, I found out that by default it will deploy a few extra services like Traefik.
Unfortunately, just like anything the default configuration is just that. It's plain and not very useful from the start. You will need to tweak it.
This step could be done either post or pre deploy. Figuring out the pre-deploy is a bit more involving but a bit more fun as well.
The first thing you need to know is that the normal behavior of k3s is to deploy anything found in /var/lib/rancher/k3s/server/manifests/.
So a good first step is, of course, to proceed with creating that.
$ mkdir -p /var/lib/rancher/k3s/server/manifests/
The other thing to know is that k3s can deploy Helm Charts. It will create the manifests it will deploy by default, before beginning the setup, in the manifest path I mentioned. If you would like to see what it deployed and how, visit that path after k3s runs. I did, and I took their configuration of Traefik which I was unhappy with its defaults.
My next step was securing the defaults as much as possible and I found out that Traefik can do basic authentication. As a starting point, that's great. Let's create the credentials.
$ htpasswd -c ./auth myUser
That was easy so far. Let's turn up the notch and create the manifest for k3s.
Create traefik.yaml in /var/lib/rancher/k3s/server/manifests/ with the following content.
---
apiVersion: helm.cattle.io/v1
kind: HelmChart
metadata:
  name: traefik
  namespace: kube-system
spec:
  chart: https://%{KUBERNETES_API}%/static/charts/traefik-1.81.0.tgz
  valuesContent: |-
    rbac:
      enabled: true
    ssl:
      enabled: true
    dashboard:
      enabled: true
      domain: traefik-ui.example.com
      auth:
        basic:
          myUser: $ars3$4A5tdstr$trSDDa4467Tsa54sTs.
    metrics:
      prometheus:
        enabled: false
    kubernetes:
      ingressEndpoint:
        useDefaultPublishedService: true
    image: "rancher/library-traefik"
    tolerations:
      - key: "CriticalAddonsOnly"
        operator: "Exists"
      - key: "node-role.kubernetes.io/master"
        operator: "Exists"
        effect: "NoSchedule"
It's a Pi, I don't need prometheus so I disabled it. I also enabled the dashboard and added the credentials we created in the previous step.
Now, the Helm Chart will deploy an ingress and expose the dashboard for you on the value of domain.
Note
I figured out the values to set in valuesContent by reading the Helm Chart
K3s
If everything is in place, you are ready to proceed. You can install k3s, now, but before I get to that step, I will say a few things about k3s.
K3s has a smaller feature set than k8s, hence the smaller footprint. Read the documentation to see if you need any of the missing features. The second thing to mention is that k3s is a one binary deploy that uses containerd. That's why we will use the script installation method as it adds the necessary systemd configuration for us. It is a nice gesture.
Let's do that, shall we ?
$ curl -sfL https://get.k3s.io | sh -s - --no-deploy traefik
Note
We need to make sure that k3s does not deploy its own traefik but ours.
Make sure to add --no-deploy traefik to our deployment command.
Point traefik.example.com to your Pi IP in /etc/hosts on your machine.
traefik.example.com 192.168.0.5
When the installation command is done, you should be able to visit http://traefik.example.com/
You can get the kubeconfig from the Raspberry Pi, you can find it in /etc/rancher/k3s/k3s.yaml. You will need to change the server IP.
Conclusion
If you've made it so far, you should have a k3s cluster running on a single Raspberry Pi. The next steps you might want to look into is disable the metrics server and use the resources for other things.
Kubernetes @kubernetes
DONE Minikube Setup minikube ingress ingress_controller
If you have ever worked with kubernetes, you'd know that minikube out of the box does not give you what you need for a quick setup. I'm sure you can go minikube start, everything's up… Great… kubectl get pods -n kube-system… It works, let's move on…
But what if it's not let's move on to something else. We need to look at this as a local test environment in capabilities. We can learn so much from it before applying to the lab. But, as always, there are a few tweaks we need to perform to give it the magic it needs to be a real environment.
Prerequisites
If you are looking into kubernetes, I would suppose that you know your linux's ABCs and you can install and configure minikube and its prerequisites prior to the beginning of this tutorial.
You can find the guide to install minikube and configure it on the minikube webpage.
Anyway, make sure you have minikube installed, kubectl and whatever driver dependencies you need to run it under that driver. In my case, I am using kvm2 which will be reflected in the commands given to start minikube.
Starting minikube
Let's start minikube.
 $ minikube start --vm-driver=kvm2
 Starting local Kubernetes v1.13.2 cluster...
 Starting VM...
 Getting VM IP address...
 Moving files into cluster...
 Setting up certs...
 Connecting to cluster...
 Setting up kubeconfig...
 Stopping extra container runtimes...
 Starting cluster components...
 Verifying apiserver health ...
 Kubectl is now configured to use the cluster.
 Loading cached images from config file.


 Everything looks great. Please enjoy minikube!
Great… At this point we have a cluster that's running, let's verify.
 #  Id   Name       State
 --------------------------
  3    minikube   running
For me, I can check virsh. If you used VirtualBox you can check that.
We can also test with kubectl.
 $ kubectl version
 Client Version: version.Info{Major:"1", Minor:"13", GitVersion:"v1.13.3", GitCommit:"721bfa751924da8d1680787490c54b9179b1fed0", GitTreeState:"clean", BuildDate:"2019-02-01T20:08:12Z", GoVersion:"go1.11.5", Compiler:"gc", Platform:"linux/amd64"}
 Server Version: version.Info{Major:"1", Minor:"13", GitVersion:"v1.13.2", GitCommit:"cff46ab41ff0bb44d8584413b598ad8360ec1def", GitTreeState:"clean", BuildDate:"2019-01-10T23:28:14Z", GoVersion:"go1.11.4", Compiler:"gc", Platform:"linux/amd64"}
Now what ? Well, now we deploy a few addons that we need to deploy in production as well for a functioning kubernetes cluster.
Let's check the list of add-ons available out of the box.
 $ minikube addons list
 - addon-manager: enabled
 - dashboard: enabled
 - default-storageclass: enabled
 - efk: disabled
 - freshpod: disabled
 - gvisor: disabled
 - heapster: enabled
 - ingress: enabled
 - kube-dns: disabled
 - metrics-server: enabled
 - nvidia-driver-installer: disabled
 - nvidia-gpu-device-plugin: disabled
 - registry: disabled
 - registry-creds: disabled
 - storage-provisioner: enabled
 - storage-provisioner-gluster: disabled
Make sure you have dashboard, heapster, ingress and metrics-server enabled. You can enable add-ons with kubectl addons enable.
What's the problem then ?
Here's the problem that comes next. How do you access the dashboard or anything running in the cluster ? Everyone online suggests you proxy a port and you access the dashboard. Is that really how it should work ? Is that how production system do it ?
The answer is of course not. They use different types of ingresses at their disposal. In this case, minikube was kind enough to provide one for us, the default kubernetes ingress controller, It's a great option for an ingress controller that's solid enough for production use. Fine, a lot of babble. Yes sure but this babble is important. So how do we access stuff on a cluster ?
To answer that question we need to understand a few things. Yes, you can use a NodePort on your service and access it that way. But do you really want to manage these ports ? What's in use and what's not ? Besides, wouldn't it be better if you can use one port for all of the services ? How you may ask ?
We've been doing it for years, and by we I mean ops and devops people. You have to understand that the kubernetes ingress controller is simply an nginx under the covers. We've always been able to configure nginx to listen for a specific hostname and redirect it where we want to. It shouldn't be that hard to do right ?
Well this is what an ingress controller does. It uses the default ports to route traffic from the outside according to hostname called. Let's look at our cluster and see what we need.
 $ kubectl get services --all-namespaces
 NAMESPACE     NAME                   TYPE        CLUSTER-IP       EXTERNAL-IP   PORT(S)             AGE
 default       kubernetes             ClusterIP   10.96.0.1                443/TCP             17m
 kube-system   default-http-backend   NodePort    10.96.77.15              80:30001/TCP        17m
 kube-system   heapster               ClusterIP   10.100.193.109           80/TCP              17m
 kube-system   kube-dns               ClusterIP   10.96.0.10               53/UDP,53/TCP       17m
 kube-system   kubernetes-dashboard   ClusterIP   10.106.156.91            80/TCP              17m
 kube-system   metrics-server         ClusterIP   10.103.137.86            443/TCP             17m
 kube-system   monitoring-grafana     NodePort    10.109.127.87            80:30002/TCP        17m
 kube-system   monitoring-influxdb    ClusterIP   10.106.174.177           8083/TCP,8086/TCP   17m
In my case, you can see that I have a few things that are in NodePort configuration and you can access them on those ports. But the kubernetes-dashboard is a ClusterIP and we can't get to it. So let's change that by adding an ingress to the service.
Ingress
An ingress is an object of kind ingress that configures the ingress controller of your choice.
---
apiVersion: extensions/v1beta1
kind: Ingress
metadata:
  name: kubernetes-dashboard
  namespace: kube-system
  annotations:
    nginx.ingress.kubernetes.io/rewrite-target: /
spec:
  rules:
  - host: dashboard.kube.local
    http:
      paths:
      - path: /
        backend:
          serviceName: kubernetes-dashboard
          servicePort: 80
Save that to a file kube-dashboard-ingress.yaml or something then run.
 $ kubectl apply -f kube-bashboard-ingress.yaml
 ingress.extensions/kubernetes-dashboard created
And now we get this.
 $ kubectl get ingress --all-namespaces
 NAMESPACE     NAME                   HOSTS                  ADDRESS   PORTS   AGE
 kube-system   kubernetes-dashboard   dashboard.kube.local             80      17s
Now all we need to know is the IP of our kubernetes cluster of one. Don't worry minikube makes it easy for us.
 $ minikube ip
 192.168.39.79
Now let's add that host to our /etc/hosts file.
192.168.39.79 dashboard.kube.local
Now if you go to http://dashboard.kube.local in your browser, you will be welcomed with the dashboard. How is that so ? Well as I explained, point it to the nodes of the cluster with the proper hostname and it works.
You can deploy multiple services that can be accessed this way, you can also integrate this with a service mesh or a service discovery which could find the up and running nodes that can redirect you to point to at all times. But this is the clean way to expose services outside the cluster.
DONE Your First Minikube Helm Deployment minikube ingress helm prometheus grafana
In the last post, we have configured a basic minikube cluster. In this post we will deploy a few items we will need in a cluster and maybe in the future, experiment with it a bit.
Prerequisite
During this post and probably during future posts, we will be using helm to deploy to our minikube cluster. Some offered by the helm team, others by the community and maybe our own. We need to install helm on our machine. It should be as easy as downloading the binary but if you can find it in your package manager go that route.
Deploying Tiller
Before we can start with the deployments using helm, we need to deploy tiller. It's a service that manages communications with the client and deployments.
 $ helm init --history-max=10
 Creating ~/.helm
 Creating ~/.helm/repository
 Creating ~/.helm/repository/cache
 Creating ~/.helm/repository/local
 Creating ~/.helm/plugins
 Creating ~/.helm/starters
 Creating ~/.helm/cache/archive
 Creating ~/.helm/repository/repositories.yaml
 Adding stable repo with URL: https://kubernetes-charts.storage.googleapis.com
 Adding local repo with URL: http://127.0.0.1:8879/charts
 $HELM_HOME has been configured at ~/.helm.

 Tiller (the Helm server-side component) has been installed into your Kubernetes Cluster.

 Please note: by default, Tiller is deployed with an insecure 'allow unauthenticated users' policy.
 To prevent this, run ``helm init`` with the --tiller-tls-verify flag.
 For more information on securing your installation see: https://docs.helm.sh/using_helm/#securing-your-helm-installation
Tiller is deployed, give it a few minutes for the pods to come up.
Deploy Prometheus
We often need to monitor multiple aspects of the cluster easily. Sometimes maybe even write our applications to (let's say) publish metrics to prometheus. And I said 'let's say' because technically we offer an endpoint that a prometheus exporter will consume regularly and publish to the prometheus server. Anyway, let's deploy prometheus.
 $ helm install stable/prometheus-operator --name prometheus-operator --namespace kube-prometheus
 NAME:   prometheus-operator
 LAST DEPLOYED: Sat Feb  9 18:09:43 2019
 NAMESPACE: kube-prometheus
 STATUS: DEPLOYED

 RESOURCES:
 ==> v1/Secret
 NAME                                           TYPE    DATA  AGE
 prometheus-operator-grafana                    Opaque  3     4s
 alertmanager-prometheus-operator-alertmanager  Opaque  1     4s

 ==> v1beta1/ClusterRole
 NAME                                              AGE
 prometheus-operator-kube-state-metrics            3s
 psp-prometheus-operator-kube-state-metrics        3s
 psp-prometheus-operator-prometheus-node-exporter  3s

 ==> v1/Service
 NAME                                          TYPE       CLUSTER-IP      EXTERNAL-IP  PORT(S)    AGE
 prometheus-operator-grafana                   ClusterIP  10.107.125.114         80/TCP     3s
 prometheus-operator-kube-state-metrics        ClusterIP  10.99.250.30           8080/TCP   3s
 prometheus-operator-prometheus-node-exporter  ClusterIP  10.111.99.199          9100/TCP   3s
 prometheus-operator-alertmanager              ClusterIP  10.96.49.73            9093/TCP   3s
 prometheus-operator-coredns                   ClusterIP  None                   9153/TCP   3s
 prometheus-operator-kube-controller-manager   ClusterIP  None                   10252/TCP  3s
 prometheus-operator-kube-etcd                 ClusterIP  None                   4001/TCP   3s
 prometheus-operator-kube-scheduler            ClusterIP  None                   10251/TCP  3s
 prometheus-operator-operator                  ClusterIP  10.101.253.101         8080/TCP   3s
 prometheus-operator-prometheus                ClusterIP  10.107.117.120         9090/TCP   3s

 ==> v1beta1/DaemonSet
 NAME                                          DESIRED  CURRENT  READY  UP-TO-DATE  AVAILABLE  NODE SELECTOR  AGE
 prometheus-operator-prometheus-node-exporter  1        1        0      1           0                   3s

 ==> v1/Deployment
 NAME                          DESIRED  CURRENT  UP-TO-DATE  AVAILABLE  AGE
 prometheus-operator-operator  1        1        1           0          3s

 ==> v1/ServiceMonitor
 NAME                                         AGE
 prometheus-operator-alertmanager             2s
 prometheus-operator-coredns                  2s
 prometheus-operator-apiserver                2s
 prometheus-operator-kube-controller-manager  2s
 prometheus-operator-kube-etcd                2s
 prometheus-operator-kube-scheduler           2s
 prometheus-operator-kube-state-metrics       2s
 prometheus-operator-kubelet                  2s
 prometheus-operator-node-exporter            2s
 prometheus-operator-operator                 2s
 prometheus-operator-prometheus               2s

 ==> v1/Pod(related)
 NAME                                                     READY  STATUS             RESTARTS  AGE
 prometheus-operator-prometheus-node-exporter-fntpx       0/1    ContainerCreating  0         3s
 prometheus-operator-grafana-8559d7df44-vrm8d             0/3    ContainerCreating  0         2s
 prometheus-operator-kube-state-metrics-7769f5bd54-6znvh  0/1    ContainerCreating  0         2s
 prometheus-operator-operator-7967865bf5-cbd6r            0/1    ContainerCreating  0         2s

 ==> v1beta1/PodSecurityPolicy
 NAME                                          PRIV   CAPS      SELINUX           RUNASUSER  FSGROUP    SUPGROUP  READONLYROOTFS  VOLUMES
 prometheus-operator-grafana                   false  RunAsAny  RunAsAny          RunAsAny   RunAsAny   false     configMap,emptyDir,projected,secret,downwardAPI,persistentVolumeClaim
 prometheus-operator-kube-state-metrics        false  RunAsAny  MustRunAsNonRoot  MustRunAs  MustRunAs  false     secret
 prometheus-operator-prometheus-node-exporter  false  RunAsAny  RunAsAny          MustRunAs  MustRunAs  false     configMap,emptyDir,projected,secret,downwardAPI,persistentVolumeClaim,hostPath
 prometheus-operator-alertmanager              false  RunAsAny  RunAsAny          MustRunAs  MustRunAs  false     configMap,emptyDir,projected,secret,downwardAPI,persistentVolumeClaim
 prometheus-operator-operator                  false  RunAsAny  RunAsAny          MustRunAs  MustRunAs  false     configMap,emptyDir,projected,secret,downwardAPI,persistentVolumeClaim
 prometheus-operator-prometheus                false  RunAsAny  RunAsAny          MustRunAs  MustRunAs  false     configMap,emptyDir,projected,secret,downwardAPI,persistentVolumeClaim

 ==> v1/ConfigMap
 NAME                                           DATA  AGE
 prometheus-operator-grafana-config-dashboards  1     4s
 prometheus-operator-grafana                    1     4s
 prometheus-operator-grafana-datasource         1     4s
 prometheus-operator-etcd                       1     4s
 prometheus-operator-grafana-coredns-k8s        1     4s
 prometheus-operator-k8s-cluster-rsrc-use       1     4s
 prometheus-operator-k8s-node-rsrc-use          1     4s
 prometheus-operator-k8s-resources-cluster      1     4s
 prometheus-operator-k8s-resources-namespace    1     4s
 prometheus-operator-k8s-resources-pod          1     4s
 prometheus-operator-nodes                      1     4s
 prometheus-operator-persistentvolumesusage     1     4s
 prometheus-operator-pods                       1     4s
 prometheus-operator-statefulset                1     4s

 ==> v1/ClusterRoleBinding
 NAME                                            AGE
 prometheus-operator-grafana-clusterrolebinding  3s
 prometheus-operator-alertmanager                3s
 prometheus-operator-operator                    3s
 prometheus-operator-operator-psp                3s
 prometheus-operator-prometheus                  3s
 prometheus-operator-prometheus-psp              3s

 ==> v1beta1/Role
 NAME                         AGE
 prometheus-operator-grafana  3s

 ==> v1beta1/Deployment
 NAME                                    DESIRED  CURRENT  UP-TO-DATE  AVAILABLE  AGE
 prometheus-operator-kube-state-metrics  1        1        1           0          3s

 ==> v1/Alertmanager
 NAME                              AGE
 prometheus-operator-alertmanager  3s

 ==> v1/ServiceAccount
 NAME                                          SECRETS  AGE
 prometheus-operator-grafana                   1        4s
 prometheus-operator-kube-state-metrics        1        4s
 prometheus-operator-prometheus-node-exporter  1        4s
 prometheus-operator-alertmanager              1        4s
 prometheus-operator-operator                  1        4s
 prometheus-operator-prometheus                1        4s

 ==> v1/ClusterRole
 NAME                                     AGE
 prometheus-operator-grafana-clusterrole  4s
 prometheus-operator-alertmanager         3s
 prometheus-operator-operator             3s
 prometheus-operator-operator-psp         3s
 prometheus-operator-prometheus           3s
 prometheus-operator-prometheus-psp       3s

 ==> v1/Role
 NAME                                   AGE
 prometheus-operator-prometheus-config  3s
 prometheus-operator-prometheus         2s
 prometheus-operator-prometheus         2s

 ==> v1beta1/RoleBinding
 NAME                         AGE
 prometheus-operator-grafana  3s

 ==> v1beta2/Deployment
 NAME                         DESIRED  CURRENT  UP-TO-DATE  AVAILABLE  AGE
 prometheus-operator-grafana  1        1        1           0          3s

 ==> v1/Prometheus
 NAME                            AGE
 prometheus-operator-prometheus  2s

 ==> v1beta1/ClusterRoleBinding
 NAME                                              AGE
 prometheus-operator-kube-state-metrics            3s
 psp-prometheus-operator-kube-state-metrics        3s
 psp-prometheus-operator-prometheus-node-exporter  3s

 ==> v1/RoleBinding
 NAME                                   AGE
 prometheus-operator-prometheus-config  3s
 prometheus-operator-prometheus         2s
 prometheus-operator-prometheus         2s

 ==> v1/PrometheusRule
 NAME                                                      AGE
 prometheus-operator-alertmanager.rules                    2s
 prometheus-operator-etcd                                  2s
 prometheus-operator-general.rules                         2s
 prometheus-operator-k8s.rules                             2s
 prometheus-operator-kube-apiserver.rules                  2s
 prometheus-operator-kube-prometheus-node-alerting.rules   2s
 prometheus-operator-kube-prometheus-node-recording.rules  2s
 prometheus-operator-kube-scheduler.rules                  2s
 prometheus-operator-kubernetes-absent                     2s
 prometheus-operator-kubernetes-apps                       2s
 prometheus-operator-kubernetes-resources                  2s
 prometheus-operator-kubernetes-storage                    2s
 prometheus-operator-kubernetes-system                     2s
 prometheus-operator-node.rules                            2s
 prometheus-operator-prometheus-operator                   2s
 prometheus-operator-prometheus.rules                      2s

 NOTES: The Prometheus Operator has been installed. Check its status by
 running: kubectl --namespace kube-prometheus get pods -l
 "release=prometheus-operator"

 Visit [[https://github.com/coreos/prometheus-operator]] for
 instructions on how to create & configure Alertmanager and Prometheus
 instances using the Operator.
At this point, prometheus has been deployed to the cluster. Give it a few minutes for all the pods to come up. Let's keep on working to get access to the rest of the consoles offered by the prometheus deployment.
Prometheus Console
Let's write an ingress configuration to expose the prometheus console. First off we need to list all the service deployed for prometheus.
 $ kubectl get service prometheus-operator-prometheus -o yaml -n kube-prometheus
 apiVersion: v1
 kind: Service
 metadata:
   creationTimestamp: "2019-02-09T23:09:55Z"
   labels:
     app: prometheus-operator-prometheus
     chart: prometheus-operator-2.1.6
     heritage: Tiller
     release: prometheus-operator
   name: prometheus-operator-prometheus
   namespace: kube-prometheus
   resourceVersion: "10996"
   selfLink: /api/v1/namespaces/kube-prometheus/services/prometheus-operator-prometheus
   uid: d038d6fa-2cbf-11e9-b74f-48ea5bb87c0b
 spec:
   clusterIP: 10.107.117.120
   ports:
   - name: web
     port: 9090
     protocol: TCP
     targetPort: web
   selector:
     app: prometheus
     prometheus: prometheus-operator-prometheus
   sessionAffinity: None
   type: ClusterIP
 status:
   loadBalancer: {}
As we can see from the service above, its name is prometheus-operator-prometheus and it's listening on port 9090.
So let's write the ingress configuration for it.
---
apiVersion: extensions/v1beta1
kind: Ingress
metadata:
  name: prometheus-dashboard
  namespace: kube-prometheus
  annotations:
    nginx.ingress.kubernetes.io/rewrite-target: /
spec:
  rules:
  - host: prometheus.kube.local
    http:
      paths:
      - path: /
        backend:
          serviceName: prometheus-operator-prometheus
          servicePort: 9090
Save the file as kube-prometheus-ingress.yaml or some such and deploy.
 $ kubectl apply -f kube-prometheus-ingress.yaml
 ingress.extensions/prometheus-dashboard created
And then add the service host to our /etc/hosts.
192.168.39.78 prometheus.kube.local
Now you can access http://prometheus.kube.local from your browser.
Grafana Console
Much like what we did with the prometheus console previously, we need to do the same to the grafana dashboard.
First step, let's check the service.
$ kubectl get service prometheus-operator-grafana -o yaml -n kube-prometheus
Gives you the following output.
---
apiVersion: v1
kind: Service
metadata:
  creationTimestamp: "2019-02-09T23:09:55Z"
  labels:
    app: grafana
    chart: grafana-1.25.0
    heritage: Tiller
    release: prometheus-operator
  name: prometheus-operator-grafana
  namespace: kube-prometheus
  resourceVersion: "10973"
  selfLink: /api/v1/namespaces/kube-prometheus/services/prometheus-operator-grafana
  uid: cffe169b-2cbf-11e9-b74f-48ea5bb87c0b
spec:
  clusterIP: 10.107.125.114
  ports:
  - name: service
    port: 80
    protocol: TCP
    targetPort: 3000
  selector:
    app: grafana
    release: prometheus-operator
  sessionAffinity: None
  type: ClusterIP
status:
  loadBalancer: {}
We get prometheus-operator-grafana and port 80. Next is the ingress configuration.
---
apiVersion: extensions/v1beta1
kind: Ingress
metadata:
  name: prometheus-grafana
  namespace: kube-prometheus
  annotations:
    nginx.ingress.kubernetes.io/rewrite-target: /
spec:
  rules:
  - host: grafana.kube.local
    http:
      paths:
      - path: /
        backend:
          serviceName: prometheus-operator-grafana
          servicePort: 80
Then we deploy.
 $ kubectl apply -f kube-grafana-ingress.yaml
 $ ingress.extensions/prometheus-grafana created
And let's not forget /etc/hosts.
192.168.39.78 grafana.kube.local
And the grafana dashboard should appear if you visit http://grafana.kube.local.
DONE Local Kubernetes Cluster on KVM rancher rancheros kvm libvirt
I wanted to explore kubernetes even more for myself and for this blog. I've worked on pieces of this at work but not the totality of the work which I would like to understand for myself. I wanted, also to explore new tools and ways to leverage the power of kubernetes.
So far, I have been using minikube to do the deployments but there is an inherit restriction that comes with using a single bundled node. Sure, it is easy to get it up and running but at some point I had to use nodePort to go around the IP restriction. This is a restriction that you will have in an actual kubernetes cluster but I will show you later how to go around it. For now, let's just get a local cluster up and running.
Objective
I needed a local kubernetes cluster using all open source tools and easy to deploy. So I went with using KVM as the hypervisor layer and installed virt-manager for shallow management. As an OS, I wanted something light and made for kubernetes. As I already know of Rancher (being an easy way to deploy kubernetes and they have done a great job so far since the launch of their Rancer 2.0) I decided to try RancherOS. So let's see how all that works together.
Requirements
Let's start by thinking about what we actually need. Rancher, the dashboard they offer is going to need a VM by itself and they recommend 4GB of RAM. I only have 16GB of RAM on my machine so I'll have to do the math to see how much I can afford to give this dashboard and manager. By looking at the RancherOS hardware requirements, I can tell that by giving a each node 2GB of RAM I should be able to host a 3 node cluster and with 2 more for the dashboard that puts me right on 8GB of RAM. So we need to create 4 VMs with 2GB of RAM each.
Installing RancherOS
Once all 4 nodes have been created, when you boot into the RancherOS ISO do the following.
Note
Because I was using libvirt, I was able to do virsh console <vm> and run these commands.
Virsh Console
If you are running these VMs on libvirt, then you can console into the box and run vi.
 # virsh list
 Id   Name      State
 -------------------------
 21   kube01    running
 22   kube02    running
 23   kube03    running
 24   rancher   running

 # virsh console rancher
Configuration
If you read the RancherOS documentation, you'll find out that you can configure the OS with a YAML configuration file so let's do that.
$ vi cloud-config.yml
And that file should hold.
---
hostname: rancher.kube.loco
ssh_authorized_keys:
  - ssh-rsa AAA...
rancher:
  network:
    interfaces:
      eth0:
        address: 192.168.122.5/24
        dhcp: false
        gateway: 192.168.122.1
        mtu: 1500
Make sure that your public ssh key is replaced in the example before and if you have a different network configuration for your VMs, change the network configuration here.
After you save that file, install the OS.
$ sudo ros install -c cloud-config.yml -d /dev/sda
Do the same for the rest of the servers and their names and IPs should be as follows (if you are following this tutorial):
 192.168.122.5   rancher.kube.loco
 192.168.122.10  kube01.kube.loco
 192.168.122.11  kube02.kube.loco
 192.168.122.12  kube03.kube.loco
Post Installation Configuration
After RancherOS has been installed, one will need to configure /etc/hosts and it should look like the following if one is working off of the Rancher box.
$ sudo vi /etc/hosts
 127.0.0.1       rancher.kube.loco
 192.168.122.5   rancher.kube.loco
 192.168.122.10  kube01.kube.loco
 192.168.122.11  kube02.kube.loco
 192.168.122.12  kube03.kube.loco
Do the same on the rest of the servers while changing the 127.0.0.1 hostname to the host of the server.
Installing Rancher
At this point, I have to stress a few facts:
-
This is not the Rancher recommended way to deploy kubernetes.
- The recommended way is of course RKE.
-
This is for testing, so I did not take into consideration backup of anything.
- There are ways to backup Rancher configuration by mounting storage from the
rancherdocker container.
- There are ways to backup Rancher configuration by mounting storage from the
If those points are understood, let's go ahead and deploy Rancher.
First, $ ssh rancher@192.168.122.5 then:
[rancher@rancher ~]$ docker run -d --restart=unless-stopped -p 80:80 -p 443:443 rancher/rancher
Give it a few minutes for the container to come up and the application as well. Meanwhile configure your /etc/hosts file on your machine.
192.168.122.5 rancher.kube.loco
Now that all that is out of the way, you can login to https://rancher.kube.loco and set your admin password and the url for Rancher.
Deploying Kubernetes
Now that everything is ready, let's deploy kubernetes the easy way.
At this point you should be greeted with a page that looks like the following.
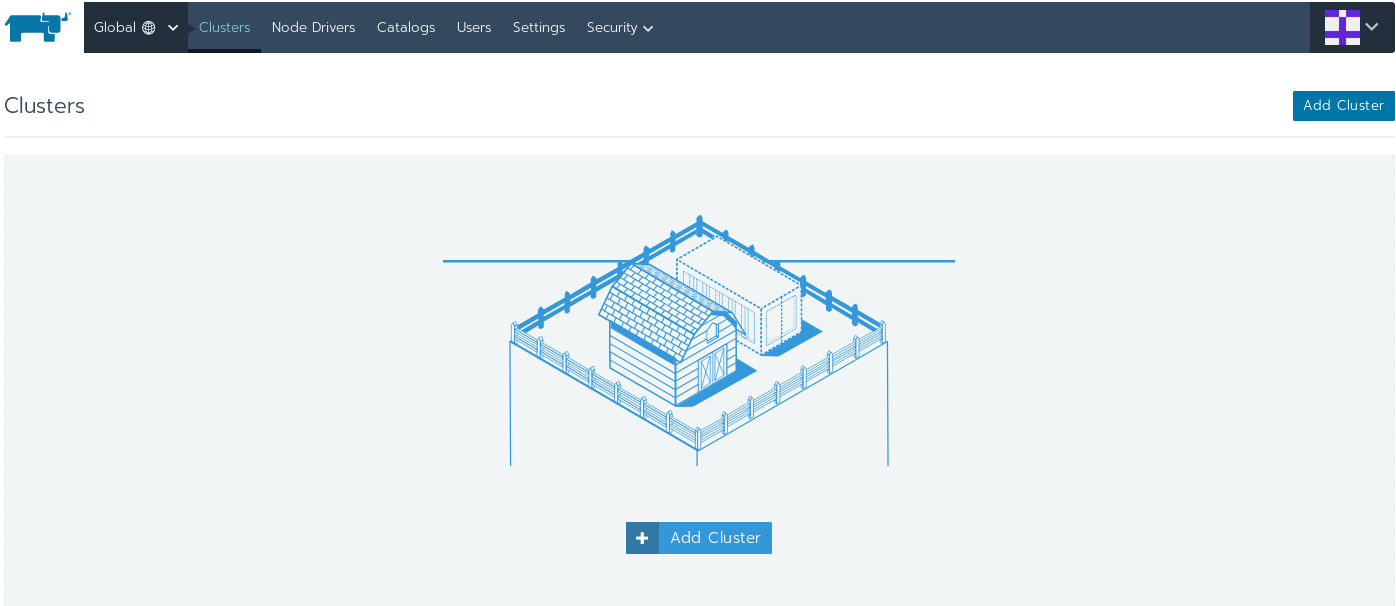
Click on the Add Cluser

Make sure you choose Custom as a provider. Then fill in the Cluser Name in our case we'll call it kube.

Optionally, you can choose your Network Providor, in my case I chose Calico. Then I clicked on show advanced at the bottom right corner then expanded the newly shown tab Advanced Cluster Options.
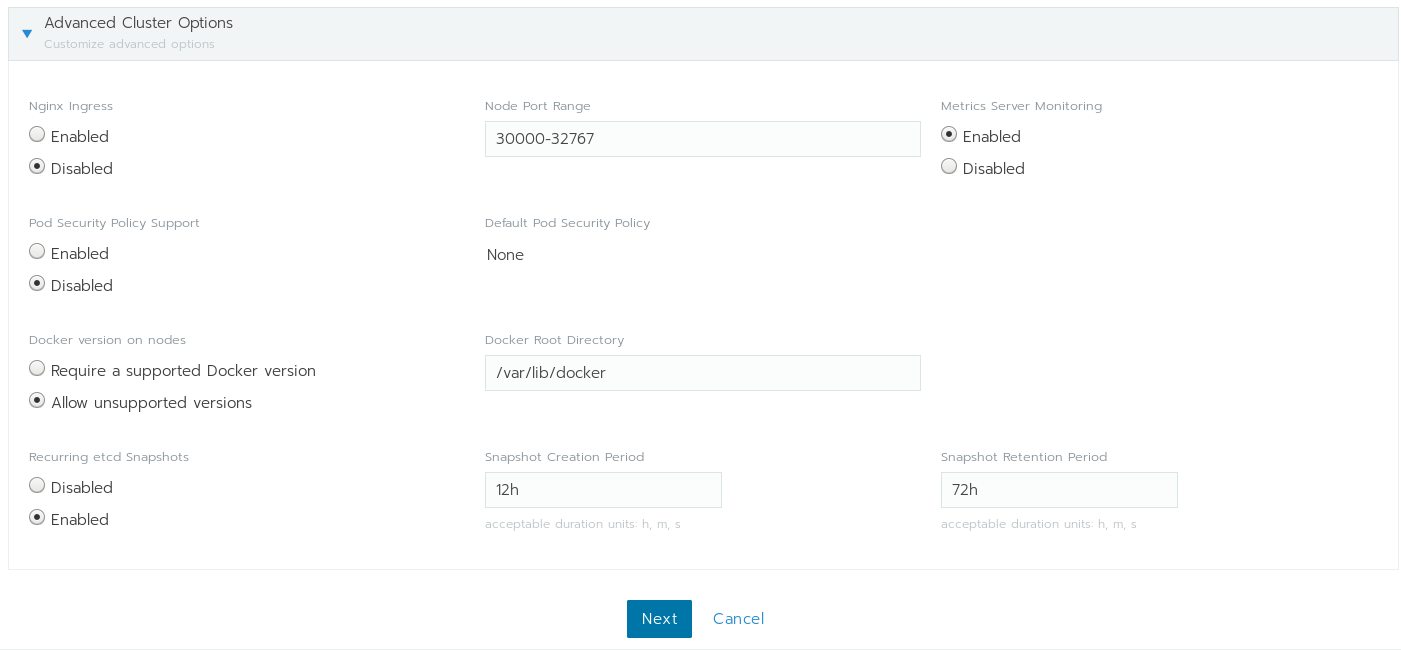
We will disable the Nginx Ingress and the Pod Security Policy Support for the time being. This will become more apparent why in the future, hopefully. Then hit Next.
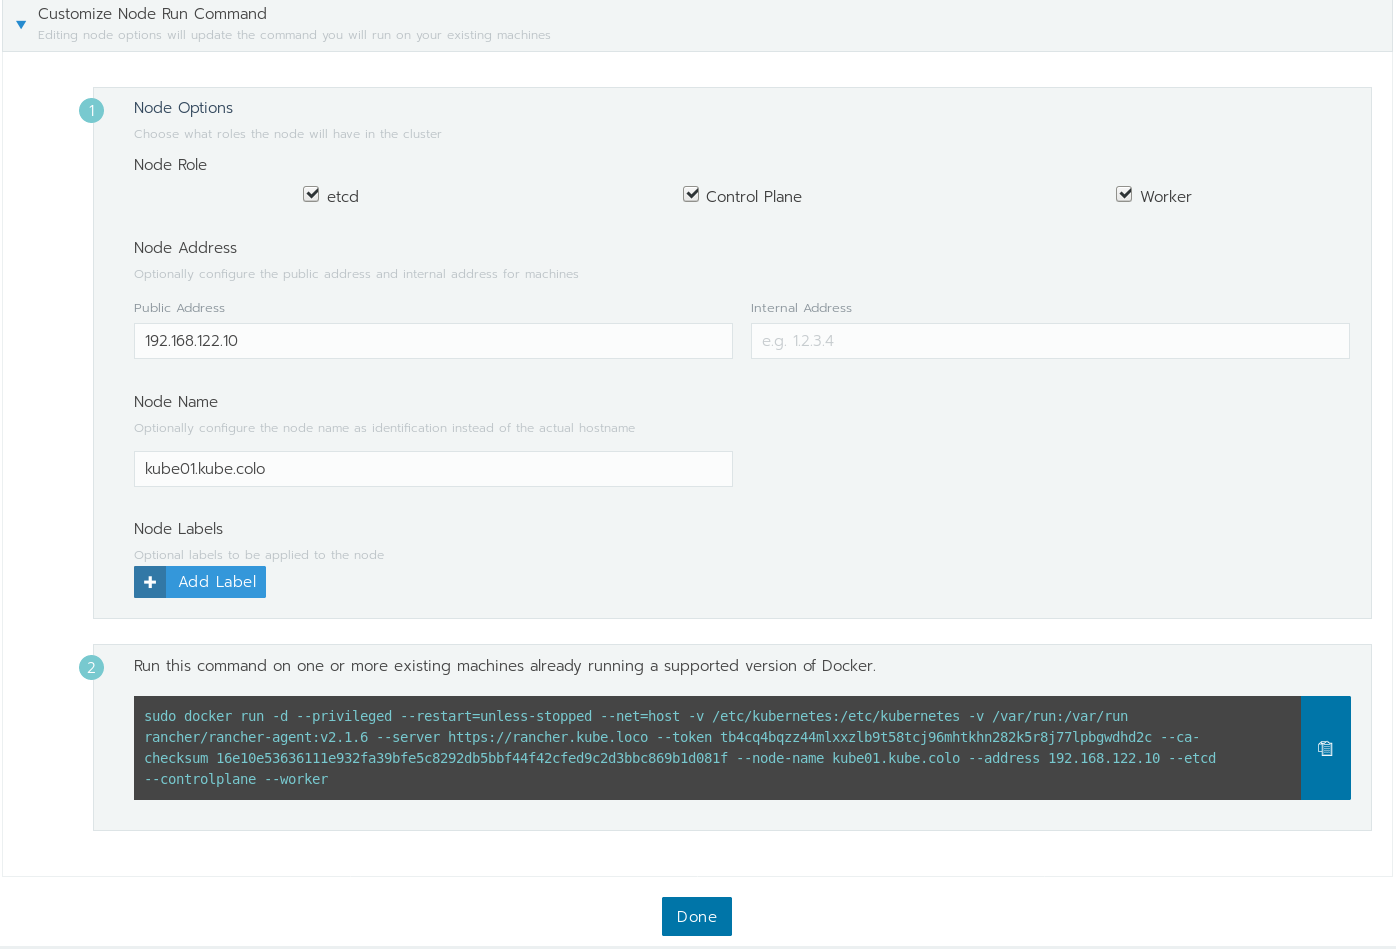
Make sure that you select all 3 Node Roles. Set the Public Address and the Node Name to the first node and then copy the command and paste it on the first node.
Do the same for all the rest. Once the first docker image gets downloaded and ran you should see a message pop at the bottom.
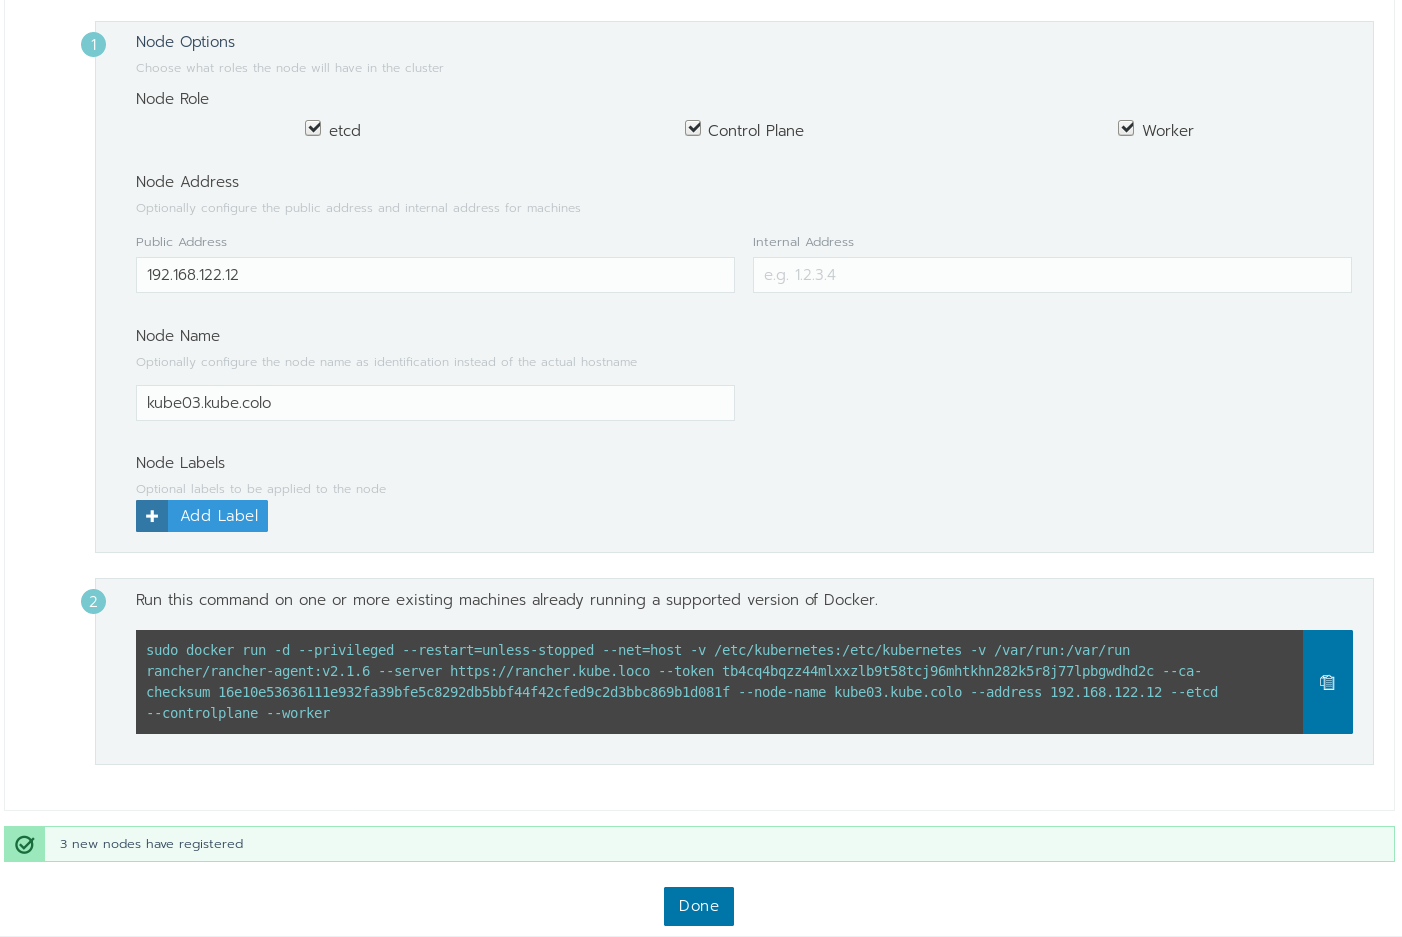
Warning
Do NOT click done until you see all 3 nodes registered.
Finalizing
Now that you have 3 registered nodes, click Done and go grab yourself a cup of coffee. Maybe take a long walk, this will take time. Or if you are curious like me, you'd be looking at the logs, checking the containers in a quad pane tmux session.
After a long time has passed, our story ends with a refresh and a welcome with this page.
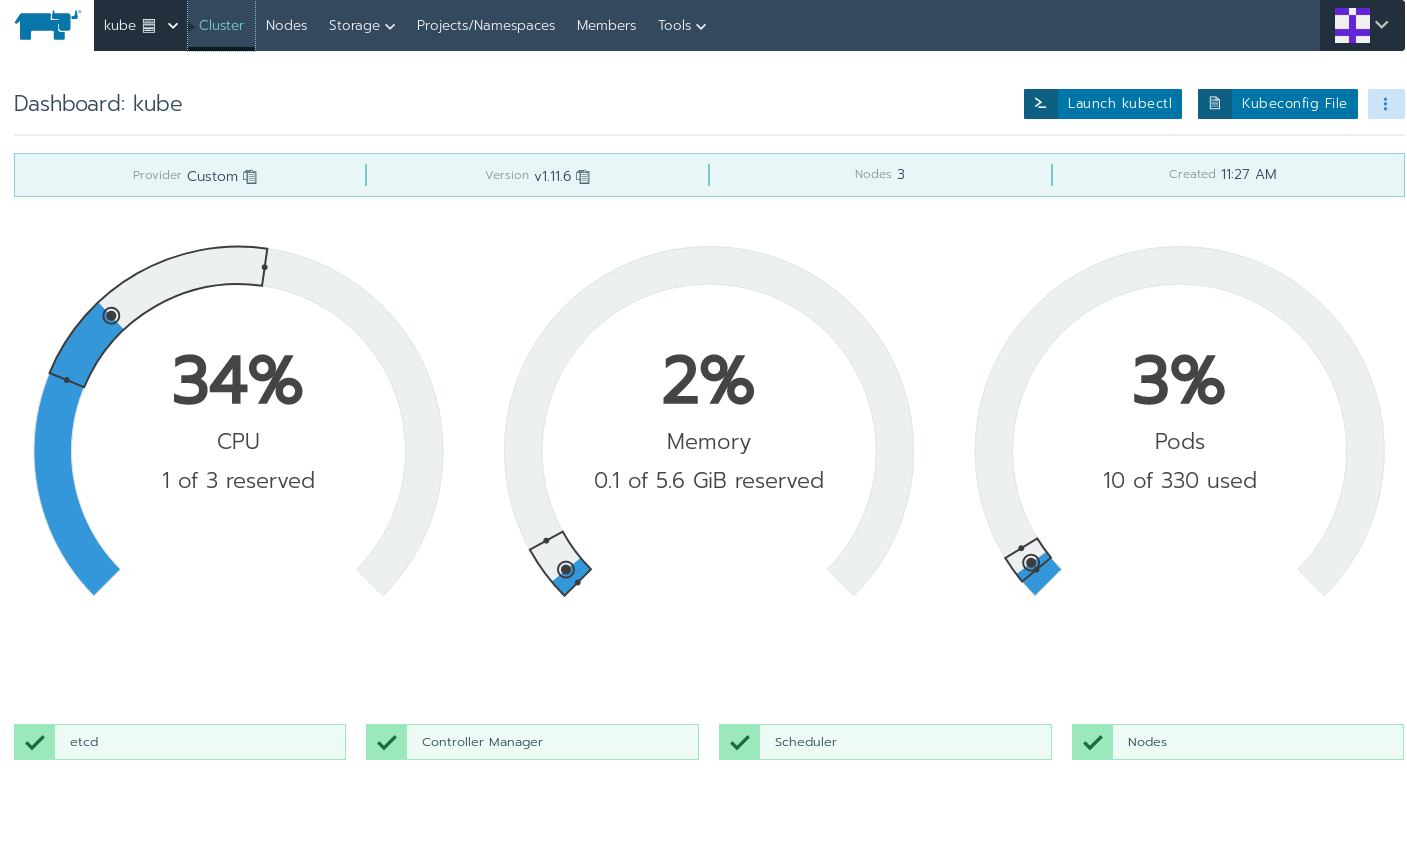
Welcome to your Kubernetes Cluster.
Conclusion
At this point, you can check that all the nodes are healthy and you got yourself a kubernetes cluster. In future blog posts we will explore an avenue to deploy multiple ingress controllers on the same cluster on the same port: 80 by giving them each an IP external to the cluster.
But for now, you got yourself a kubernetes cluster to play with. Enjoy.
DONE Deploying Helm in your Kubernetes Cluster helm tiller
In the previous post in the kubernetes series, we deployed a small kubernetes cluster locally on KVM. In future posts we will be deploying more things into the cluster. This will enable us to test different projects, ingresses, service meshes, and more from the open source community, build specifically for kubernetes. To help with this future quest, we will be leveraging a kubernetes package manager. You've read it right, helm is a kubernetes package manager. Let's get started shall we ?
Helm
As mentioned above, helm is a kubernetes package manager. You can read more about the helm project on their homepage. It offers a way to Go template the deployments of service and package them into a portable package that can be installed using the helm command line.
Generally, you would install the helm binary on your machine and install it into the cluster. In our case, the RBACs deployed in the kubernetes cluster by rancher prevent the default installation from working. Not a problem, we can go around the problem and we will in this post. This is a win for us because this will give us the opportunity to learn more about helm and kubernetes.
Note
This is not a production recommended way to deploy helm. I would NOT deploy helm this way on a production cluster. I would restrict the permissions of any ServiceAccount deployed in the cluster to its bare minimum requirements.
What are we going to do ?
We need to understand a bit of what's going on and what we are trying to do. To be able to do that, we need to understand how helm works. From a high level, the helm command line tool will deploy a service called Tiller as a Deployment.
The Tiller service talks to the kubernetes API and manages the deployment process while the helm command line tool talks to Tiller from its end. So a proper deployment of Tiller in a kubernetes sense is to create a ServiceAccount, give the ServiceAccount the proper permissions to be able to do what it needs to do and you got yourself a working Tiller.
Service Account
This is where we start by creating a ServiceAccount. The ServiceAccount looks like this.
---
apiVersion: v1
kind: ServiceAccount
metadata:
  name: tiller
  namespace: kube-system
We de deploy the ServiceAccount to the cluster. Save it to ServiceAccount.yaml.
 $ kubectl apply -f ServiceAccount.yaml
 serviceaccount/tiller created
Note
To read more about ServiceAccount and their uses please visit the kubernetes documentation page on the topic.
Cluster Role Binding
We have Tiller (ServiceAccount) deployed in kube-system (namespace). We need to give it access.
Option 1
We have the option of either creating a Role which would restrict Tiller to the current namespace, then tie them together with a RoleBinding.
This option will restrict Tiller to that namespace and that namespace only.
Option 2
Another option is to create a ClusterRole and tie the ServiceAccount to that ClusterRole with a ClusterRoleBinding and this will give Tiller access across namespaces.
Option 3
In our case, we already know that ClustRole cluster-admin already exists in the cluster so we are going to give Tiller cluster-admin access.
---
apiVersion: rbac.authorization.k8s.io/v1
kind: ClusterRoleBinding
metadata:
  name: tiller
roleRef:
  apiGroup: rbac.authorization.k8s.io
  kind: ClusterRole
  name: cluster-admin
subjects:
  - kind: ServiceAccount
    name: tiller
    namespace: kube-system
Save the following in ClusterRoleBinding.yaml and then
 $ kubectl apply -f ClusterRoleBinding.yaml
 clusterrolebinding.rbac.authorization.k8s.io/tiller created
Deploying Tiller
Now that we have all the basics deployed, we can finally deploy Tiller in the cluster.
 $  helm init --service-account tiller --tiller-namespace kube-system --history-max 10
 Creating ~/.helm
 Creating ~/.helm/repository
 Creating ~/.helm/repository/cache
 Creating ~/.helm/repository/local
 Creating ~/.helm/plugins
 Creating ~/.helm/starters
 Creating ~/.helm/cache/archive
 Creating ~/.helm/repository/repositories.yaml
 Adding stable repo with URL: https://kubernetes-charts.storage.googleapis.com
 Adding local repo with URL: http://127.0.0.1:8879/charts
 $HELM_HOME has been configured at ~/.helm.

 Tiller (the Helm server-side component) has been installed into your Kubernetes Cluster.

 Please note: by default, Tiller is deployed with an insecure 'allow unauthenticated users' policy.
 To prevent this, run `helm init` with the --tiller-tls-verify flag.
 For more information on securing your installation see: https://docs.helm.sh/using_helm/#securing-your-helm-installation
 Happy Helming!
Note
Please make sure you read the helm installation documentation if you are deploying this in a production environment. You can find how you can make it more secure there.
After a few minutes, your Tiller deployment or as it's commonly known as a helm install or a helm init. If you want to check that everything has been deployed properly you can run.
 $ helm version
 Client: &version.Version{SemVer:"v2.13.0", GitCommit:"79d07943b03aea2b76c12644b4b54733bc5958d6", GitTreeState:"clean"}
 Server: &version.Version{SemVer:"v2.13.0", GitCommit:"79d07943b03aea2b76c12644b4b54733bc5958d6", GitTreeState:"clean"}
Everything seems to be working properly. In future posts, we will be leveraging the power and convenience of helm to expand our cluster's capabilities and learn more about what we can do with kubernetes.
MISC @misc
DONE A Quick ZFS Overview on Linux zfs file_system
I have, for years, been interested in file systems. Specifically a file system to run my personal systems on. For most people Ext4 is good enough and that is totally fine. But, as a power user, I like to have more control, more features and more options out of my file system.
I have played with most of file sytsems on Linux, and have been using Btrfs for a few years now. I have worked with NAS systems running on ZFS and have been very impressed by it. The only problem is that ZFS wasn't been well suppored on Linux at the time. Btrfs promissed to be the ZFS replacement for Linux nativetly, especially that it was backed up by a bunch of the giants like Oracle and RedHat. My decision at that point was made, and yes that was before RedHat's support for XFS which is impressive on its own. Recently though, a new project gave everyone hope. OpenZFS came to life and so did ZFS on Linux.
Linux has had ZFS support for a while now but mostly to manage a ZFS file system, so I kept watching until I saw a blog post by Ubuntu entitled Enhancing our ZFS support on Ubuntu 19.10 – an introduction.
In the blog post above, I read the following:
We want to support ZFS on root as an experimental installer option, initially for desktop, but keeping the layout extensible for server later on. The desktop will be the first beneficiary in Ubuntu 19.10. Note the use of the term ‘experimental' though!
My eyes widened at this point. I know that Ubuntu has had native ZFS support since 2016 but now I could install it with one click. At that point I was all in, and I went back to Ubuntu.
Ubuntu on root ZFS
You heard me right, the Ubuntu installer offers an 'experimental' install on ZFS. I made the decision based on the well tested stability of ZFS in production environments and its ability to offer me the flexibility and the ability to backup and recover my data easily. In other words, if Ubuntu doesn't work, ZFS is there and I can install whatever I like on top and if you are familiar with ZFS you know exactly what I mean and I have barely scratched the ice on its capabilities.
So here I was with Ubuntu installed on my laptop on root ZFS. So I had to do it.
 # zpool status -v
   pool: bpool
  state: ONLINE
 status: The pool is formatted using a legacy on-disk format.  The pool can
   still be used, but some features are unavailable.
 action: Upgrade the pool using 'zpool upgrade'.  Once this is done, the
   pool will no longer be accessible on software that does not support
   feature flags.
   scan: none requested
 config:

   NAME         STATE     READ WRITE CKSUM
   bpool        ONLINE       0     0     0
     nvme0n1p4  ONLINE       0     0     0

 errors: No known data errors

   pool: rpool
  state: ONLINE
   scan: none requested
 config:

   NAME         STATE     READ WRITE CKSUM
   rpool        ONLINE       0     0     0
     nvme0n1p5  ONLINE       0     0     0

 errors: No known data errors
Note
I have read somewhere in a blog about Ubuntu that I should not run an upgrade on the boot pool.
and it's running on…
 # uname -s -v -i -o
 Linux #28-Ubuntu SMP Wed Dec 18 05:37:46 UTC 2019 x86_64 GNU/Linux
Well that was pretty easy.
ZFS Pools
Let's take a look at how the installer has configured the pools.
 # zpool list
 NAME    SIZE  ALLOC   FREE  CKPOINT  EXPANDSZ   FRAG    CAP  DEDUP    HEALTH  ALTROOT
 bpool  1,88G   158M  1,72G        -         -      -     8%  1.00x    ONLINE  -
 rpool   472G  7,91G   464G        -         -     0%     1%  1.00x    ONLINE  -
So it creates a boot pool and a root pool. Maybe looking at the datasets would give us a better idea.
ZFS Datasets
Let's look at the sanitized version of the datasets.
 # zfs list
 NAME                                               USED  AVAIL     REFER  MOUNTPOINT
 bpool                                              158M  1,60G      176K  /boot
 bpool/BOOT                                         157M  1,60G      176K  none
 bpool/BOOT/ubuntu_xxxxxx                           157M  1,60G      157M  /boot
 rpool                                             7,92G   449G       96K  /
 rpool/ROOT                                        4,53G   449G       96K  none
 rpool/ROOT/ubuntu_xxxxxx                          4,53G   449G     3,37G  /
 rpool/ROOT/ubuntu_xxxxxx/srv                        96K   449G       96K  /srv
 rpool/ROOT/ubuntu_xxxxxx/usr                       208K   449G       96K  /usr
 rpool/ROOT/ubuntu_xxxxxx/usr/local                 112K   449G      112K  /usr/local
 rpool/ROOT/ubuntu_xxxxxx/var                      1,16G   449G       96K  /var
 rpool/ROOT/ubuntu_xxxxxx/var/games                  96K   449G       96K  /var/games
 rpool/ROOT/ubuntu_xxxxxx/var/lib                  1,15G   449G     1,04G  /var/lib
 rpool/ROOT/ubuntu_xxxxxx/var/lib/AccountServices    96K   449G       96K  /var/lib/AccountServices
 rpool/ROOT/ubuntu_xxxxxx/var/lib/NetworkManager    152K   449G      152K  /var/lib/NetworkManager
 rpool/ROOT/ubuntu_xxxxxx/var/lib/apt              75,2M   449G     75,2M  /var/lib/apt
 rpool/ROOT/ubuntu_xxxxxx/var/lib/dpkg             36,5M   449G     36,5M  /var/lib/dpkg
 rpool/ROOT/ubuntu_xxxxxx/var/log                  11,0M   449G     11,0M  /var/log
 rpool/ROOT/ubuntu_xxxxxx/var/mail                   96K   449G       96K  /var/mail
 rpool/ROOT/ubuntu_xxxxxx/var/snap                  128K   449G      128K  /var/snap
 rpool/ROOT/ubuntu_xxxxxx/var/spool                 112K   449G      112K  /var/spool
 rpool/ROOT/ubuntu_xxxxxx/var/www                    96K   449G       96K  /var/www
 rpool/USERDATA                                    3,38G   449G       96K  /
 rpool/USERDATA/user_yyyyyy                        3,37G   449G     3,37G  /home/user
 rpool/USERDATA/root_yyyyyy                        7,52M   449G     7,52M  /root
Note
The installer have created some random IDs that I have not figured out if they are totally random or mapped to something so I have sanitized them. I also sanitized the user, of course. ;)
It looks like the installer created a bunch of datasets with their respective mountpoints.
ZFS Properties
ZFS has a list of features and they are tunable in different ways, one of them is through the properties, let's have a look.
 # zfs get all rpool
 NAME   PROPERTY              VALUE                 SOURCE
 rpool  type                  filesystem            -
 rpool  creation              vr jan 24 23:04 2020  -
 rpool  used                  7,91G                 -
 rpool  available             449G                  -
 rpool  referenced            96K                   -
 rpool  compressratio         1.43x                 -
 rpool  mounted               no                    -
 rpool  quota                 none                  default
 rpool  reservation           none                  default
 rpool  recordsize            128K                  default
 rpool  mountpoint            /                     local
 ...
This gives us an idea on properties set on the dataset specified, in this case, the rpool root dataset.
Conclusion
I read in a blog post that the Ubuntu team responsible for the ZFS support has followed all the ZFS best practices in the installer. I have no way of verifying that as I am not a ZFS expert but I'll be happy to take their word for it until I learn more. What is certain for now is that I am running on ZFS, and I will be enjoying its features to the fullest.
DONE Email Setup with isync, notmuch, afew, msmtp and Emacs email isync notmuch afew msmtp emacs
I was asked recently about how I have my email client setup. As I naturally do, I replied with something along the lines of the following.
I use isync, notmuch, afew and msmtp with emacs as an interface, let me get you a link on how I did my setup from my blog.
To my surprise, I never wrote about the topic. I guess this is as better time as any to do so.
Let's dig in.
Bird's-eye View
Looking at the big list of tools mentioned in the title, I could understand how one could get intimidated but I assure you these are very basic, yet very powerful, tools.
First task is to divide and conquer, as usual. We start by the first piece of the puzzle, understand email.
In a very simplified way of thinking of email is that each email is simply a file. This file has all the information needed as to who sent it to whom, from which server, etc… The bottom line is that it's simply a file in a folder somewhere on a server. Even though this might not be the case on the server, in this setup it will most certainly be the case locally on your filesystem. Thinking about it in terms of files in directories also makes sense because it will most likely be synchronized back with the server that way as well.
Now you might ask, what tool would offer us such a way to synchronize emails and my answer would be… Very many, of course… come on this is Linux and Open Source ! Don't ask silly questions… But to what's relevant to my setup it's isync.
Now that I have the emails locally on my filesystem, I need a way to interact with them. Some prefer to work with directories, I prefer to work with tags instead. That's where notmuch comes in. You can think of it as an email tagging and querying system. To make my life simpler, I utilize afew to handle a few basic email tasks to save me from writing a lot of notmuch rules.
I already make use of emacs extensively in my day to day life and having a notmuch interface in emacs is great. I can use emacs to view, tag, search and send email.
Oh wait, right… I wouldn't be able to send email without msmtp.
isync
isync is defined as
a command line application which synchronizes mailboxes.
While isync currently supports Maildir and IMAP4 mailboxes, it has the very logical command of mbsync. Of course !
Now, isync is very well documented in the man pages.
man mbsyncEverything you need is there, have fun reading.
While you read the man pages to figure out what you want, I already did that and here's what I want in my ~/.mbsyncrc.
##########################
# Personal Configuration #
##########################

# Name Account
IMAPAccount Personal
Host email.hostname.com
User personal@email.hostname.com
Pass "yourPassword"
# One can use a command which returns the password
# Such as a password manager or a bash script
#PassCmd sh script/path
SSLType IMAPS
CertificateFile /etc/ssl/certs/ca-certificates.crt

IMAPStore personal-remote
Account Personal

MaildirStore personal-local
Subfolders Verbatim
Path ~/.mail/
Inbox ~/.mail/Inbox

Channel sync-personal-inbox
Master :personal-remote:"Inbox"
Slave :personal-local:Inbox
Create Slave
SyncState *
CopyArrivalDate yes

Channel sync-personal-archive
Master :personal-remote:"Archive"
Slave :personal-local:Archive
Create Slave
SyncState *
CopyArrivalDate yes

Channel sync-personal-sent
Master :personal-remote:"Sent"
Slave :personal-local:Sent
Create Slave
SyncState *
CopyArrivalDate yes

Channel sync-personal-trash
Master :personal-remote:"Junk"
Slave :personal-local:Trash
Create Slave
SyncState *
CopyArrivalDate yes

# Get all the channels together into a group.
Group Personal
Channel sync-personal-inbox
Channel sync-personal-archive
Channel sync-personal-sent
Channel sync-personal-trash
The following will synchronize both ways the following folders:
- Remote "Inbox" with local "Inbox"
- Remote "Archive" with local "Archive"
- Remote "Sent" with local "Sent"
- Remote "Junk" with local "Trash"
Those are the only directories I care about.
With the configuration in place, we can try to sync the emails.
mbsync -C -a -Vnotmuch
You can read more about notmuch on their webpage. Their explanation is interesting to say the least.
What notmuch does, is create a database where it saves all the tags and relevant information for all the emails. This makes it extremely fast to query and do different operations on large numbers of emails.
I use notmuch mostly indirectly through emacs, so my configuration is very simple. All I want from notmuch is to tag all new emails with the new tag.
# .notmuch-config - Configuration file for the notmuch mail system
#
# For more information about notmuch, see https://notmuchmail.org

# Database configuration
#
# The only value supported here is 'path' which should be the top-level
# directory where your mail currently exists and to where mail will be
# delivered in the future. Files should be individual email messages.
# Notmuch will store its database within a sub-directory of the path
# configured here named ".notmuch".
#
[database]
path=/home/user/.mail/

# User configuration
#
# Here is where you can let notmuch know how you would like to be
# addressed. Valid settings are
#
#	name		Your full name.
#	primary_email	Your primary email address.
#	other_email	A list (separated by ';') of other email addresses
#			at which you receive email.
#
# Notmuch will use the various email addresses configured here when
# formatting replies. It will avoid including your own addresses in the
# recipient list of replies, and will set the From address based on the
# address to which the original email was addressed.
#
[user]
name=My Name
primary_email=user@email.com
# other_email=email1@example.com;email2@example.com;

# Configuration for "notmuch new"
#
# The following options are supported here:
#
#	tags	A list (separated by ';') of the tags that will be
#		added to all messages incorporated by "notmuch new".
#
#	ignore	A list (separated by ';') of file and directory names
#		that will not be searched for messages by "notmuch new".
#
#		NOTE: *Every* file/directory that goes by one of those
#		names will be ignored, independent of its depth/location
#		in the mail store.
#
[new]
tags=new;
#tags=unread;inbox;
ignore=

# Search configuration
#
# The following option is supported here:
#
#	exclude_tags
#		A ;-separated list of tags that will be excluded from
#		search results by default.  Using an excluded tag in a
#		query will override that exclusion.
#
[search]
exclude_tags=deleted;spam;

# Maildir compatibility configuration
#
# The following option is supported here:
#
#	synchronize_flags      Valid values are true and false.
#
#	If true, then the following maildir flags (in message filenames)
#	will be synchronized with the corresponding notmuch tags:
#
#		Flag	Tag
#		----	-------
#		D	draft
#		F	flagged
#		P	passed
#		R	replied
#		S	unread (added when 'S' flag is not present)
#
#	The "notmuch new" command will notice flag changes in filenames
#	and update tags, while the "notmuch tag" and "notmuch restore"
#	commands will notice tag changes and update flags in filenames
#
[maildir]
synchronize_flags=true
Now that notmuch is configured the way I want it to, I use it as follows.
notmuch newYup, that simple.
This will tag all new emails with the new tag.
afew
Once all the new emails have been properly tagged with the new tag by notmuch, afew comes in.
afew is defined as an initial tagging script for notmuch. The reason of using it will become evident very soon but let me quote some of what their Github page says.
It can do basic thing such as adding tags based on email headers or maildir folders, handling killed threads and spam.
In move mode, afew will move mails between maildir folders according to configurable rules that can contain arbitrary notmuch queries to match against any searchable attributes.
This is where the bulk of the configuration is, in all honesty. At this stage, I had to make a decision of how would I like to manage my emails ?
I think it should be simple if I save them as folders on the server as it doesn't support tags. I can derive the basic tags from the folders and keep a backup of my database for all the rest of the tags.
My configuration looks similar to the following.
# ~/.config/afew/config
[global]

[SpamFilter]
[KillThreadsFilter]
[ListMailsFilter]
[SentMailsFilter]
[ArchiveSentMailsFilter]
sent_tag = sent

[DMARCReportInspectionFilter]

[Filter.0]
message = Tagging Personal Emails
query = 'folder:.mail/'
tags = +personal

[FolderNameFilter.0]
folder_explicit_list = .mail/Inbox .mail/Archive .mail/Drafts .mail/Sent .mail/Trash
folder_transforms = .mail/Inbox:personal .mail/Archive:personal .mail/Drafts:personal .mail/Sent:personal .mail/Trash:personal
folder_lowercases = true

[FolderNameFilter.1]
folder_explicit_list = .mail/Archive
folder_transforms = .mail/Archive:archive
folder_lowercases = true

[FolderNameFilter.2]
folder_explicit_list = .mail/Sent
folder_transforms = .mail/Sent:sent
folder_lowercases = true

[FolderNameFilter.3]
folder_explicit_list = .mail/Trash
folder_transforms = .mail/Trash:deleted
folder_lowercases = true

[Filter.1]
message = Untagged 'inbox' from 'archive'
query = 'tag:archive AND tag:inbox'
tags = -inbox

[MailMover]
folders = .mail/Inbox
rename = True
max_age = 7
.mail/Inbox = 'tag:deleted':.mail/Trash 'tag:archive':.mail/Archive

# what's still new goes into the inbox
[InboxFilter]
Basically, I make sure that all the emails, in their folders, are tagged properly. I make sure the emails which need to be moved are moved to their designated folders. The rest is simply the inbox.
Note
The read / unread tag is automatically handled between notmuch and isync. It's seemlessly synchronized between the tools.
With the configuration in place, I run afew.
afew -v -t --new
For moving the emails, I use afew as well but I apply it on all emails and not just the ones tagged with new.
afew -v -m --allmsmtp
msmtp is an SMTP client. It sends email.
The configuration is very simple.
# Set default values for all following accounts.
defaults
auth           on
tls            on
tls_trust_file /etc/ssl/certs/ca-certificates.crt
logfile        ~/.msmtp.log

# Mail
account        personal
host           email.hostname.com
port           587
from           personal@email.hostname.com
user           personal@email.hostname.com
password       yourPassword
# One can use a command which returns the password
# Such as a password manager or a bash script
# passwordeval sh script/path

# Set a default account
account default : personal
Emacs
I use Doom as a configuration framework for Emacs. notmuch comes as a modules which I enabled, but you might want to check the notmuch's Emacs Documentation page for help with installation and configuration.
I wanted to configure the notmuch interface a bit to show me what I'm usually interested in.
(setq +notmuch-sync-backend 'mbsync)
(setq notmuch-saved-searches '((:name "Unread"
                                :query "tag:inbox and tag:unread"
                                :count-query "tag:inbox and tag:unread"
                                :sort-order newest-first)
                               (:name "Inbox"
                                :query "tag:inbox"
                                :count-query "tag:inbox"
                                :sort-order newest-first)
                               (:name "Archive"
                                :query "tag:archive"
                                :count-query "tag:archive"
                                :sort-order newest-first)
                               (:name "Sent"
                                :query "tag:sent or tag:replied"
                                :count-query "tag:sent or tag:replied"
                                :sort-order newest-first)
                               (:name "Trash"
                                :query "tag:deleted"
                                :count-query "tag:deleted"
                                :sort-order newest-first))
      )
Now, all I have to do is simply open the notmuch interface in Emacs.
Conclusion
To put everything together, I wrote a bash script with the commands provided above in series. This script can be called by a cron or even manually to synchronize emails.
From the Emacs interface I can do pretty much everything I need to do.
Future improvements I have to think about is the best way to do email notifications. There are a lot of different ways I can approach this. I can use notmuch to query for what I want. I could maybe even try querying the information out of the Xapian database. But that's food for thought.
I want email to be simple and this makes it simple for me. How are you making email simple for you ?
DONE Email IMAP Setup with isync email isync imap
The blog post "#email-setup-with-isync-notmuch-afew-msmtp-and-emacs" prompted a few questions. The questions were around synchronizing email in general.
I did promise to write up more blog posts to explain the pieces I brushed over quickly for brevity and ease of understanding. Or so I thought !
Maildir
Let's talk Maildir. Wikipedia defines it as the following.
The Maildir e-mail format is a common way of storing email messages in which each message is stored in a separate file with a unique name, and each mail folder is a file system directory. The local file system handles file locking as messages are added, moved and deleted. A major design goal of Maildir is to eliminate the need for program code to handle file locking and unlocking.
It is basically what I mentioned before. Think of your emails as folders and files. The image will get clearer, so let's dig even deeper.
If you go into a Maildir directory, let's say Inbox and list all the directories in there, you'll find tree of them.
$ ls
cur/  new/  tmp/
These directories have a purpose.
tmp/: This directory stores all temporary files and files in the process of being delivered.new/: This directory stores all new files that have not yet been seen by any email client.cur/: This directory stores all the files that have been previously seen.
This is basically how emails are going to be represented on your disk. You will need to find an email client which can parse these files and work with them.
IMAP
The Internet Mail Access Protocol, shortened to IMAP, is an
Internet standard protocol used by email clients to retrieve email messages from a mail server over a TCP/IP connection.
In simple terms, it is a way of communication that allows synchronization between a client and an email server.
What can you do with that information ?
Now, you have all the pieces of the puzzle to figure out how to think about your email on disk and how to synchronize it. It might be a good idea to dive a little bit into my configuration and why I chose these settings to begin with. Shall we ?
isync
Most email servers nowadays offer you an IMAP (POP3 was another protocol used widely back in the day) endpoint to connect to. You might be using Outlook or Thunderbird or maybe even Claws-mail as an email client. They usually show you the emails in a neat GUI (Graphical User Interface) with all the read and unread mail and the folders. If you've had the chance to configure one of these clients a few years ago, you would've needed to find the IMAP host and port of the server. These clients talk IMAP too.
isync is an application to synchronize mailboxes. I use it to connect to my email server using IMAP and synchronize my emails to my hard drive as a Maildir.
IMAP
The very first section of the configuration is the IMAP section.
IMAPAccount Personal
Host email.hostname.com
User personal@email.hostname.com
Pass "yourPassword"
# One can use a command which returns the password
# Such as a password manager or a bash script
#PassCmd sh script/path
SSLType IMAPS
CertificateFile /etc/ssl/certs/ca-certificates.crt

IMAPStore personal-remote
Account Personal
In here, we configure the IMAP settings. Most notably here is of course Host, User and Pass/PassCmd. These settings refer to your server and you should populate them with that information.
The IMAPStore is used further in the configuration, this gives a name for the IMAP Store. In simple terms, if you want to refer to your server you use personal-remote.
Maildir
The next section of the configuration is the Maildir part. You can think of this as where do you want your emails to be saved on disk.
MaildirStore personal-local
Subfolders Verbatim
Path ~/.mail/
Inbox ~/.mail/Inbox
This should be self explanatory but I'd like to point out the MaildirStore key. This refers to email on disk. So, if you want to refer to your emails on disk you use personal-local.
At this point, you are thinking to yourself what the hell does that mean ? What is this dude talking about ! Don't worry, I got you.
Synchronize to your taste
This is where all what you've learned comes together. The fun part ! The part where you get to choose how you want to do things.
Here's what I want. I want to synchronize my server Inbox with my on disk Inbox both ways. If the Inbox folder does not exist on disk, create it. The name of the Inbox on the server is Inbox.
This can be translated to the following.
Channel sync-personal-inbox
Master :personal-remote:"Inbox"
Slave :personal-local:Inbox
Create Slave
SyncState *
CopyArrivalDate yes
I want to do the same with Archive and Sent.
Channel sync-personal-archive
Master :personal-remote:"Archive"
Slave :personal-local:Archive
Create Slave
SyncState *
CopyArrivalDate yes

Channel sync-personal-sent
Master :personal-remote:"Sent"
Slave :personal-local:Sent
Create Slave
SyncState *
CopyArrivalDate yes
At this point, I still have my trash. The trash on the server is called Junk but I want it to be Trash on disk. I can do that easily as follows.
Channel sync-personal-trash
Master :personal-remote:"Junk"
Slave :personal-local:Trash
Create Slave
SyncState *
CopyArrivalDate yes
I choose to synchronize my emails both ways. If you prefer, for example, not to download the sent emails and only synchronize them up to the server, you can do that with SyncState. Check the mbsync manual pages.
Tie the knot
At the end, add all the channel names configured above under the save Group with the same account name.
Group Personal
Channel sync-personal-inbox
Channel sync-personal-archive
Channel sync-personal-sent
Channel sync-personal-trash
Conclusion
This is pretty much it. It is that simple. This is how I synchronize my email. How do you ?
DONE A Python Environment Setup python pipx pyenv virtual_environment virtualfish
I've been told that python package management is bad. I have seen some really bad practices online, asking you to run commands here and there without an understanding of the bigger picture, what they do and sometimes with escalated privileges.
Along the years, I have compiled a list of practices I follow, and a list of tools I use. I hope to be able to share some of the knowledge I've acquired and show you a different way of doing things. You might learn about a new tool, or a new use for a tool. Come along for the ride !
Python
As most know, Python is an interpreted programming language. I am not going to go into the details of the language in this post, I will only talk about management.
If you want to develop in Python, you need to install libraries. You can find some in your package manager but let's face it pip is your way.
The majority of Linux distributions will have Python installed as a lot of system packages now rely on it, even some package managers.
Okay, this is the last time I actually use the system's Python. What ? Why ? You ask !
pyenv
I introduce you to pyenv. Pyenv is a Python version management tool, it allows you to install and manage different versions of Python as a user.
Beautiful, music to my ears.
Let's get it from the package manager, this is a great use of the package manager if it offers an up to date version of the package.
sudo pacman -S pyenvIf you're not using an Archlinux based distribution follow the instructions on their webpage.
Alright ! Now that we've got ourselves pyenv, let's configure it real quickly.
Following the docs, I created ~/.config/fish/config.d/pyenv.fish and in it I put the following.
# Add pyenv executable to PATH by running
# the following interactively:

set -Ux PYENV_ROOT $HOME/.pyenv
set -U fish_user_paths $PYENV_ROOT/bin $fish_user_paths

# Load pyenv automatically by appending
# the following to ~/.config/fish/config.fish:

status is-login; and pyenv init --path | source
Open a new shell and you're all ready to continue along, you're all locked, loaded and ready to go!
Setup the environment
This is the first building block of my environment. We first start by querying for Python versions available for us.
pyenv install --listThen, we install the latest Python version. Yes, even if it's an upgrade, I'll handle the upgrade, as well, as we go along.
Set everything up to use the new installed version.
First, we set the global Python version for our user.
pyenv global 3.9.5Then, we switch our current shell's Python version, instead of opening a new shell.
pyenv shell 3.9.5That was easy. We test that everything works as expected by checking the version.
pyenv version
Now, if you do a which on the python executable, you will find that it is in the pyenv shims' directory.
Upgrade
In the future, the upgrade path is exactly the same as the setup path shown above. You query for the list of Python versions available, choose the latest and move on from there. Very easy, very simple.
pip
pip is the package installer for Python.
At this stage, you have to understand that you are using a Python version installed by pyenv as your user. The pip provided, if you do a which, is also in the same shims directory.
Using pip at this stage as a user is better than running it as root but it is also not touching your system; just your user. We can do one better. I'm going to use pip as a user once !
I know, you will have a lot of questions at this point as to why. You will see, patience is a virtue.
pipx
Meet pipx, this tool is the amazing companion for a DevOps, and developer alike. Why ? You would ask.
It, basically, creates Python virtual environments for packages you want to have access to globally. For example, I'd like to have access to a Python LSP server on the go. This way my text editor has access to it too and, of course, can make use of it freely. Anyway, let's cut this short and show you. You will understand better.
Let's use the only pip command as a user to install pipx.
pip install --user pipxWarning
You are setting yourself up for a world of hurt if you use sudo with pip or run it as root. ONLY run commands as root or with escalated privileges when you know what you're doing.
LSP Server
As I gave the LSP server as an example, let's go ahead and install it with some other Python packages needed for global things like emacs.
pipx install black
pipx install ipython
pipx install isort
pipx install nose
pipx install pytest
pipx install python-lsp-server
Now each one is in it's own happy little virtual environment separated from any other dependency but its own. Isn't that lovely ?
If you try to run ipython, you will see that it will actually work. If you look deeper at it, you will see that it is pointing to ~/.local/bin/ipython which is a symlink to the actual package in a pipx virtual environment.
Upgrade
After you set a new Python version with pyenv, you simply reinstall everything.
pipx reinstall-allAnd like magic, everything get recreated using the new version of Python newly set.
virtualfish
Now that pipx is installed, let's go head and install something to manage our Python virtual environments on-demand, for use whenever we need to, for targeted projects.
Some popular choices people use are Pipenv, Poetry, virtualenv and plain and simple python with the venv module.
You're welcome to play with all of them. Considering I use fish as my default shell, I like to use virtualfish.
Let's install it.
pipx install virtualfish
This offers me a new command; vf. With vf, I can create Python virtual environments and they will all be saved in a directory of my choosing.
Setup
Let's create one for Ansible.
vf new ansibleThis should activate it. Then, we install Ansible.
pip install ansible molecule docker
At this stage, you will notice that you have ansible installed. You will also notice that all the pipx packages are also still available.
If you want to tie virtualfish to a specific directory, use vf connect.
Upgrade
To upgrade the Python version of all of our virtual environments, virtualfish makes it as easy as
vf upgradeAnd we're done !
Workflow
At this stage, you have an idea about the tools I use and where their scope falls. I like them because they are limited to their own scope, each has its own little domain where it reigns.
- I use pyenv to install and manage different versions of Python for testing purposes while I stay on the latest.
- I use pipx for the commands that I need access to globally as a user.
- I use virtualfish to create one or more virtual environment per project I work on.
With this setup, I can test with different versions of Python by creating different virtual environments with different version each, or two versions of the tool you're testing as you keep the Python version static. It could also be different versions of a library, testing forward compatibility for example.
At each step, I have an upgrade path to keep all my environments running the latest versions. I also have a lot of flexibility by using requirements.txt files and others for development sometimes or even testing.
Conclusion
As you can see, with a little bit of knowledge and by standing on the shoulders of giants, you can easily manage a Python environment entirely as a user. You have full access to a wide array of Python distributions to play with. Endless different versions of packages, globally and locally installed. If you create virtual environments for each of your projects, you won't fall in the common pitfalls of versioning hell. Keep your virtual environments numerous and dedicated to projects, small sets, and you won't face any major problems with keeping your system clean yet up to date.
DONE My Path Down The Road of Cloudflare's Redirect Loop cloudflare cdn
I have used Cloudflare as my DNS manager for years, specifically because it offers API that works with certbot. This setup has worked very well for me so far. The only thing that kept bothering me is that every time I turn on the CDN capability on my Cloudflare , I get a loor error. That's weird.
Setup
Let's talk about my setup for a little bit. I use certbot to generate and maintain my fleet of certificates. I use Nginx as a web-server.
Let's say I want to host a static content off of my server. My nginx configuration would look something like the following.
 server {
     listen   443 ssl;
     server_name  server.example.com;

     ssl_certificate /path/to/the/fullchain.pem;
     ssl_certificate_key /path/to/the/privkey.pem;

     root   /path/to/data/root/;
     index  index.html;

     location / {
             try_files $uri $uri/ =404;
     }
 }
This is a static site, of course. Now you may ask about non-SSL. Well, I don't do non-SSL. In other words, I have something like this in my config.
 server {
     listen 80;
     server_name _;

     location / {
         return 301 https://$host$request_uri;
     }
 }
So, all http traffic gets redirected to https.
Problem
Considering the regular setup above, once I enable the "proxy" feature of Cloudflare I get the following error.

![file:images/my-path-down-the-road-of-cloudflare-s-redirect-loop/flexible-encryption.png][file:images/my-path-down-the-road-of-cloudflare-s-redirect-loop/flexible-encryption.png](file:images/my-path-down-the-road-of-cloudflare-s-redirect-loop/flexible-encryption.png][file:images/my-path-down-the-road-of-cloudflare-s-redirect-loop/flexible-encryption.png "flexible-encryption.png") This is interesting.
It says that the connection is encrypted between the broswer and *Cloudflare*.
Does that mean that between *Cloudflare* and my server, the connection is unencrypted ?
If that's the case, it means that the request coming from *Cloudflare* to my server is coming on /http/.
If it is coming on /http/, it is getting redirected to /https/ which goes back to *Cloudflare* and so on.
#+BEGIN_EXAMPLE
THIS IS IT ! I FOUND MY ANSWER...
#+END_EXAMPLE
Alright, let's move this to what they call "Full Encryption", which calls my server on /https/ as it should.
#+caption: Full Encryption
#+attr_html: :target _blank
This is interesting.
It says that the connection is encrypted between the broswer and *Cloudflare*.
Does that mean that between *Cloudflare* and my server, the connection is unencrypted ?
If that's the case, it means that the request coming from *Cloudflare* to my server is coming on /http/.
If it is coming on /http/, it is getting redirected to /https/ which goes back to *Cloudflare* and so on.
#+BEGIN_EXAMPLE
THIS IS IT ! I FOUND MY ANSWER...
#+END_EXAMPLE
Alright, let's move this to what they call "Full Encryption", which calls my server on /https/ as it should.
#+caption: Full Encryption
#+attr_html: :target _blank
![file:images/my-path-down-the-road-of-cloudflare-s-redirect-loop/full-encryption.png][file:images/my-path-down-the-road-of-cloudflare-s-redirect-loop/full-encryption.png](file:images/my-path-down-the-road-of-cloudflare-s-redirect-loop/full-encryption.png][file:images/my-path-down-the-road-of-cloudflare-s-redirect-loop/full-encryption.png "full-encryption.png") After this change, all the errors cleared up and got my blog up and
running again.
*** DONE The Story Behind cmw :python:development:
:PROPERTIES:
:EXPORT_HUGO_LASTMOD: 2019-08-31
:EXPORT_DATE: 2019-08-31
:EXPORT_FILE_NAME: the-story-behind-cmw
:CUSTOM_ID: the-story-behind-cmw
:END:
A few days ago, https://kushaldas.in][Kushal Das shared a curl command.
The command was as follows:
#+BEGIN_EXAMPLE
$ curl https://wttr.in/
#+END_EXAMPLE
I, obviously, was curious.
I ran it and it was interesting.
So it returns the weather right ? Pretty cool huh!
#+hugo: more
**** The interest
That got me interested to learn how does this work exactly.
**** The investigation
I looked at https://wttr.in/][https://wttr.in/ and it seemed to have a GitHub https://github.com/chubin/wttr.in][link and a repository.
That is very interesting.
This is a Python application, one can tell by the code or if you prefer the GitHub bar at the top.
Anyway, one can also tell that this is a https://palletsprojects.com/p/flask/][Flask application from the following code in the bin/srv.py.
#+BEGIN_SRC python
from flask import Flask, request, send_from_directory
APP = Flask(__name__)
#+END_SRC
By reading the README.md of the repository one can read.
#+BEGIN_QUOTE
wttr.in uses http://github.com/schachmat/wego][wego for
visualization and various data sources for weather forecast
information.
#+END_QUOTE
Let's jump to the /wego/ repository then.
/wego/ seems to be a command line application to graph the weather in the terminal.
Great, so what I did with https://scm.project42.io/elia/cmw][cmw is already done in Go and API'fied by a different project.
My answer to that accusation is obviously this post.
**** The idea
I played a bit more with https://wttr.in/][https://wttr.in/ and I found it to an interesting API.
I am trying to work on my python development foo so to me that was a perfect little project to work on.
From my perspective this was simply an API and I am to consume it to put it back in my terminal.
**** The work
The beginning work was very rough and hidden away in a private repository and was moved later https://scm.project42.io/elia/cmw][here.
The only thing left from that work is the =--format= argument which allows you full control over what gets sent.
But again, let's not forget what the real purpose of this project was.
So I decided to make the whole API as accessible as possible from the command line tool I am writing.
#+BEGIN_EXAMPLE
$ cmw --help
usage: cmw [-h] [-L LOCATION] [-f FORMAT] [-l LANG] [-m] [-u] [-M] [-z] [-o]
[-w] [-A] [-F] [-n] [-q] [-Q] [-N] [-P] [-p] [-T] [-t TRANSPARENCY]
[--v2] [--version]
Get the weather!
optional arguments:
-h, --help show this help message and exit
-L LOCATION, --location LOCATION
Location (look at epilog for more information)
-f FORMAT, --format FORMAT
Query formatting
-l LANG, --lang LANG The language to use
-m, --metric Units: Metric (SI) (default outside US)
-u, --uscs Units: USCS (default in US)
-M, --meter-second Units: Show wind speed in m/s
-z, --zero View: Only current weather
-o, --one View: Current weather & one day
-w, --two View: Current weather & two days
-A, --ignore-user-agent
View: Force ANSI output format
-F, --follow-link View: Show the 'Follow' line from upstream
-n, --narrow View: Narrow version
-q, --quiet View: Quiet version
-Q, --super-quiet View: Super quiet version
-N, --no-colors View: Switch terminal sequences off
-P, --png PNG: Generate PNG file
-p, --add-frame PNG: Add frame around output
-T, --mid-transparency
PNG: Make transparency 150
-t TRANSPARENCY, --transparency TRANSPARENCY
PNG: Set transparency between 0 and 255
--v2 v2 interface of the day
--version show program's version number and exit
Supported Location Types
------------------------
City name: Paris
Unicode name: Москва
Airport code (3 letters): muc
Domain name: @stackoverflow.com
Area code: 94107
GPS coordinates: -78.46,106.79
Special Location
----------------
Moon phase (add ,+US
or ,+France
for these cities): moon
Moon phase for a date: moon@2016-10-25
Supported languages
-------------------
Supported: af da de el et fr fa hu id it nb nl pl pt-br ro ru tr uk vi
#+END_EXAMPLE
#+BEGIN_EXAMPLE
$ cmw --location London --lang nl --one
Weerbericht voor: London
\ / Zonnig
.-. 20 °C
― ( ) ― → 19 km/h
`-’ 10 km
/ \ 0.0 mm
┌─────────────┐
┌──────────────────────────────┬───────────────────────┤ za 31 aug ├───────────────────────┬──────────────────────────────┐
│ 's Ochtends │ 's Middags └──────┬──────┘ 's Avonds │ 's Nachts │
├──────────────────────────────┼──────────────────────────────┼──────────────────────────────┼──────────────────────────────┤
│ \ / Gedeeltelijk b…│ \ / Gedeeltelijk b…│ Bewolkt │ \ / Gedeeltelijk b…│
│ _ /"".-. 21 °C │ _ /"".-. 23..24 °C │ .--. 20 °C │ _ /"".-. 18 °C │
│ \_( ). ↗ 12-14 km/h │ \_( ). ↗ 18-20 km/h │ .-( ). ↗ 20-25 km/h │ \_( ). → 16-19 km/h │
│ /(___(__) 10 km │ /(___(__) 10 km │ (___.__)__) 10 km │ /(___(__) 10 km │
│ 0.0 mm | 0% │ 0.0 mm | 0% │ 0.0 mm | 0% │ 0.0 mm | 0% │
└──────────────────────────────┴──────────────────────────────┴──────────────────────────────┴──────────────────────────────┘
Locatie: London [51.509648,-0.099076]
#+END_EXAMPLE
**** Conclusion
All I got to say in conclusion is that it was a lot of fun working on https://scm.project42.io/elia/cmw][cmw and I learned a lot.
I'm not going to publish the package on https://pypi.org/][PyPI because seriously, what's the point.
But if you are interested in making changes to the repository, make an MR.
*** DONE QMK Firmware :qmk:firmware:mechanical_keyboard:qmk_firmware:
:PROPERTIES:
:EXPORT_HUGO_LASTMOD: 2021-09-23
:EXPORT_DATE: 2021-09-23
:EXPORT_FILE_NAME: qmk-firmware
:CUSTOM_ID: qmk-firmware
:END:
Over the years, I have owned a few mechanical keyboards. I'm quite fond of them.
I've also built my own keyboard from scratch years ago. Hot-swappable back then
was still in its easy stages and the sockets weren't that good. Alas, we're in
2021 and I've recently purchased the *Keychron Q1* keyboard.
I've chosen this keyboard for many reasons, but the one you most care about is
the topic that brought you here. It's a *QMK Firmware* compatible keyboards. Do
you know what that means ?
That means that we're going to be digging into ~qmk_firmware~. Tag along !
#+hugo: more
**** Quantum Mechanical Keyboard Firmware
The https://github.com/qmk/qmk_firmware][*QMK Firmware* is
#+begin_quote
a keyboard firmware based on the tmk_keyboard firmware with some useful features
for Atmel AVR and ARM controllers, and more specifically, the OLKB product line,
the ErgoDox EZ keyboard, and the Clueboard product line.
#+end_quote
It goes beyond saying, the *QMK Firmware* is open sourced. So let's hack it.
**** Building QMK Firmware
The first step to flashing your keyboard starts here. We need to get the source
code of ~qmk_firmware~ from Github.
#+begin_src shell
$ git clone https://github.com/qmk/qmk_firmware.git
# Wait a while...
# Yup, I know !
# Okay finally...
Cloning into 'qmk_firmware'...
remote: Enumerating objects: 295442, done.
remote: Counting objects: 100% (34/34), done.
remote: Compressing objects: 100% (27/27), done.
remote: Total 295442 (delta 13), reused 17 (delta 5), pack-reused 295408
Receiving objects: 100% (295442/295442), 178.92 MiB | 7.10 MiB/s, done.
Resolving deltas: 100% (178414/178414), done.
Updating files: 100% (27916/27916), done.
$ cd qmk_firmware
#+end_src
Once the repository is clone, we can start with installing the dependencies to
build ~qmk~.
I'm not a big fan of auto-installers or installers scripts
(=util/install/arch.sh=), and here's why.
#+begin_src bash
python3 -m pip install --user -r $QMK_FIRMWARE_DIR/requirements.txt
#+end_src
This is how the installer of the ~qmk_firmware~ concludes the round. I would
hate to use pip to install willy nilly like that.
Otherwise, I don't have objections to what it does on ~arch~ at least.
It does the following, I see no reason not to follow it.
#+begin_src shell
$ sudo pacman -S \
base-devel clang diffutils gcc git unzip wget zip python-pip \
avr-binutils arm-none-eabi-binutils arm-none-eabi-gcc \
arm-none-eabi-newlib avrdude dfu-programmer dfu-util
$ sudo pacman -U https://archive.archlinux.org/packages/a/avr-gcc/avr-gcc-8.3.0-1-x86_64.pkg.tar.xz
$ sudo pacman -S avr-libc # Must be installed after the above, or it will bring in the latest avr-gcc instead
$ sudo pacman -S hidapi # This will fail if the community repo isn't enabled
#+end_src
Now that all the dependencies required by the system are installed, let's
install the ~python~ dependencies.
#+begin_src shell
$ git checkout 0.14.9 # Checkout the latest version
$ vf new qmk_firmware # Create a new python virtualenv and activate it
$ pip install -r requirements.txt # Install python requirements
$ pip install qmk
$ make git-submodule
#+end_src
Finally, we can build our keyboard firmware.
#+begin_src bash
$ qmk compile -kb keychron/q1/rev_0100 -km default
Ψ Compiling keymap with make --jobs=1 keychron/q1/rev_0100:default [31/494]
QMK Firmware 0.14.16
Making keychron/q1/rev_0100 with keymap default
avr-gcc (GCC) 11.2.0
Copyright (C) 2021 Free Software Foundation, Inc.
This is free software; see the source for copying conditions. There is NO
warranty; not even for MERCHANTABILITY or FITNESS FOR A PARTICULAR PURPOSE.
Compiling: keyboards/keychron/q1/q1.c [OK]
Compiling: keyboards/keychron/q1/rev_0100/rev_0100.c [OK]
Compiling: keyboards/keychron/q1/rev_0100/keymaps/default/keymap.c [OK]
Compiling: quantum/quantum.c [OK]
Compiling: quantum/send_string.c [OK]
Compiling: quantum/bitwise.c [OK]
Compiling: quantum/led.c [OK]
Compiling: quantum/action.c [OK]
Compiling: quantum/action_layer.c [OK]
Compiling: quantum/action_macro.c [OK]
Compiling: quantum/action_tapping.c [OK]
Compiling: quantum/action_util.c [OK]
Compiling: quantum/eeconfig.c [OK]
Compiling: quantum/keyboard.c [OK]
Compiling: quantum/keymap_common.c [OK]
Compiling: quantum/keycode_config.c [OK]
Compiling: quantum/logging/debug.c [OK]
Compiling: quantum/logging/sendchar.c [OK]
Compiling: quantum/bootmagic/bootmagic_lite.c [OK]
Compiling: quantum/bootmagic/magic.c [OK]
Compiling: quantum/matrix_common.c [OK]
Compiling: quantum/matrix.c [OK]
Compiling: quantum/debounce/sym_defer_g.c [OK]
Compiling: quantum/main.c [OK]
Compiling: quantum/color.c [OK]
Compiling: quantum/rgb_matrix/rgb_matrix.c [OK]
Compiling: quantum/rgb_matrix/rgb_matrix_drivers.c [OK]
Compiling: lib/lib8tion/lib8tion.c [OK]
Compiling: drivers/led/issi/is31fl3733.c [OK]
Compiling: quantum/process_keycode/process_rgb.c [OK]
Compiling: quantum/led_tables.c [OK]
Compiling: quantum/dip_switch.c [OK]
Compiling: quantum/process_keycode/process_space_cadet.c [OK]
Compiling: quantum/process_keycode/process_magic.c [OK]
Compiling: quantum/process_keycode/process_grave_esc.c [OK]
Compiling: platforms/avr/drivers/i2c_master.c [OK]
Archiving: .build/obj_keychron_q1_rev_0100_default/i2c_master.o [OK]
Compiling: tmk_core/common/host.c [OK]
Compiling: tmk_core/common/report.c [OK]
Compiling: tmk_core/common/sync_timer.c [OK]
Compiling: tmk_core/common/usb_util.c [OK]
Compiling: tmk_core/common/avr/platform.c [OK]
Compiling: tmk_core/common/avr/suspend.c [OK]
Compiling: tmk_core/common/avr/timer.c [OK]
Compiling: tmk_core/common/avr/bootloader.c [OK]
Assembling: tmk_core/common/avr/xprintf.S [OK]
Compiling: tmk_core/common/avr/printf.c [OK]
Compiling: tmk_core/protocol/lufa/lufa.c [OK]
Compiling: tmk_core/protocol/usb_descriptor.c [OK]
Compiling: lib/lufa/LUFA/Drivers/USB/Class/Common/HIDParser.c [OK]
Compiling: lib/lufa/LUFA/Drivers/USB/Core/AVR8/Device_AVR8.c [OK]
Compiling: lib/lufa/LUFA/Drivers/USB/Core/AVR8/EndpointStream_AVR8.c [OK]
Compiling: lib/lufa/LUFA/Drivers/USB/Core/AVR8/Endpoint_AVR8.c [OK]
Compiling: lib/lufa/LUFA/Drivers/USB/Core/AVR8/Host_AVR8.c [OK]
Compiling: lib/lufa/LUFA/Drivers/USB/Core/AVR8/PipeStream_AVR8.c [OK]
Compiling: lib/lufa/LUFA/Drivers/USB/Core/AVR8/Pipe_AVR8.c [OK]
Compiling: lib/lufa/LUFA/Drivers/USB/Core/AVR8/USBController_AVR8.c [OK]
Compiling: lib/lufa/LUFA/Drivers/USB/Core/AVR8/USBInterrupt_AVR8.c [OK]
Compiling: lib/lufa/LUFA/Drivers/USB/Core/ConfigDescriptors.c [OK]
Compiling: lib/lufa/LUFA/Drivers/USB/Core/DeviceStandardReq.c [OK]
Compiling: lib/lufa/LUFA/Drivers/USB/Core/Events.c [OK]
Compiling: lib/lufa/LUFA/Drivers/USB/Core/HostStandardReq.c [OK]
Compiling: lib/lufa/LUFA/Drivers/USB/Core/USBTask.c [OK]
Compiling: tmk_core/protocol/lufa/usb_util.c [OK]
Linking: .build/keychron_q1_rev_0100_default.elf [OK]
Creating load file for flashing: .build/keychron_q1_rev_0100_default.hex [OK]
Copying keychron_q1_rev_0100_default.hex to qmk_firmware folder [OK]
Checking file size of keychron_q1_rev_0100_default.hex [OK]
* The firmware size is fine - 23302/28672 (81%, 5370 bytes free)
#+end_src
Look at tha, easy as pie ! You got yourself a compiled firmware.
Before we move on, let's look at the command again and figure out what the hell
I did, just in case you're running a different keyboard.
If you look into the =keyboards/=, you'll be able to find a big list of
keyboards supported. The =keychron/q1/rev_0100= is simply a directory in there
that matches my keyboard. Inside that directory, we can find the =keymaps/=
directory. This is where all the keymaps live. We chose the ~default~ keymap
which is a directory in there as well.
**** Remapping the keyboard
At this stage, we were able to succesfully compile the keyboard firmware. But
the whole point of this is to modify the layout of the keyboard so let's go
right ahead.
There are commands suggested on the ~QMK~ docs but I didn't go that far, I
simply copied the =default= directory and went down to business. For the sake of
this blog post, I'll assume I called the directory =functions=.
The =keymap.c= file looks as follows.
#+begin_src c
#include QMK_KEYBOARD_H
enum layers{
MAC_BASE,
MAC_FN,
WIN_BASE,
WIN_FN
};
#define KC_TASK LGUI(KC_TAB)
#define KC_FLXP LGUI(KC_E)
const uint16_t PROGMEM keymaps[][MATRIX_ROWS][MATRIX_COLS] = {
[MAC_BASE] = LAYOUT_ansi_82(
KC_ESC, KC_BRID, KC_BRIU, KC_F3, KC_F4, RGB_VAD, RGB_VAI, KC_MPRV, KC_MPLY, KC_MNXT, KC_MUTE, KC_VOLD, KC_VOLU, KC_DEL, KC_INS,
KC_GRV, KC_1, KC_2, KC_3, KC_4, KC_5, KC_6, KC_7, KC_8, KC_9, KC_0, KC_MINS, KC_EQL, KC_BSPC, KC_PGUP,
KC_TAB, KC_Q, KC_W, KC_E, KC_R, KC_T, KC_Y, KC_U, KC_I, KC_O, KC_P, KC_LBRC, KC_RBRC, KC_BSLS, KC_PGDN,
KC_CAPS, KC_A, KC_S, KC_D, KC_F, KC_G, KC_H, KC_J, KC_K, KC_L, KC_SCLN, KC_QUOT, KC_ENT, KC_HOME,
KC_LSFT, KC_Z, KC_X, KC_C, KC_V, KC_B, KC_N, KC_M, KC_COMM, KC_DOT, KC_SLSH, KC_RSFT, KC_UP,
KC_LCTL, KC_LALT, KC_LGUI, KC_SPC, KC_RGUI, MO(MAC_FN),KC_RCTL, KC_LEFT, KC_DOWN, KC_RGHT),
[MAC_FN] = LAYOUT_ansi_82(
KC_TRNS, KC_F1, KC_F2, KC_F3, KC_F4, KC_F5, KC_F6, KC_F7, KC_F8, KC_F9, KC_F10, KC_F11, KC_F12, KC_TRNS, KC_TRNS,
KC_TRNS, KC_TRNS, KC_TRNS, KC_TRNS, KC_TRNS, KC_TRNS, KC_TRNS, KC_TRNS, KC_TRNS, KC_TRNS, KC_TRNS, KC_TRNS, KC_TRNS, KC_TRNS, KC_TRNS,
RGB_TOG, RGB_MOD, RGB_VAI, RGB_HUI, RGB_SAI, RGB_SPI, KC_TRNS, KC_TRNS, KC_TRNS, KC_TRNS, KC_TRNS, KC_TRNS, KC_TRNS, KC_TRNS, KC_TRNS,
KC_TRNS, RGB_RMOD, RGB_VAD, RGB_HUD, RGB_SAD, RGB_SPD, KC_TRNS, KC_TRNS, KC_TRNS, KC_TRNS, KC_TRNS, KC_TRNS, KC_TRNS, KC_TRNS,
KC_TRNS, KC_TRNS, KC_TRNS, KC_TRNS, KC_TRNS, KC_TRNS, KC_TRNS, KC_TRNS, KC_TRNS, KC_TRNS, KC_TRNS, KC_TRNS, KC_TRNS,
KC_TRNS, KC_TRNS, KC_TRNS, KC_TRNS, KC_TRNS, KC_TRNS, KC_TRNS, KC_TRNS, KC_TRNS, KC_TRNS),
[WIN_BASE] = LAYOUT_ansi_82(
KC_ESC, KC_F1, KC_F2, KC_F3, KC_F4, KC_F5, KC_F6, KC_F7, KC_F8, KC_F9, KC_F10, KC_F11, KC_F12, KC_DEL, KC_INS,
KC_GRV, KC_1, KC_2, KC_3, KC_4, KC_5, KC_6, KC_7, KC_8, KC_9, KC_0, KC_MINS, KC_EQL, KC_BSPC, KC_PGUP,
KC_TAB, KC_Q, KC_W, KC_E, KC_R, KC_T, KC_Y, KC_U, KC_I, KC_O, KC_P, KC_LBRC, KC_RBRC, KC_BSLS, KC_PGDN,
KC_CAPS, KC_A, KC_S, KC_D, KC_F, KC_G, KC_H, KC_J, KC_K, KC_L, KC_SCLN, KC_QUOT, KC_ENT, KC_HOME,
KC_LSFT, KC_Z, KC_X, KC_C, KC_V, KC_B, KC_N, KC_M, KC_COMM, KC_DOT, KC_SLSH, KC_RSFT, KC_UP,
KC_LCTL, KC_LGUI, KC_LALT, KC_SPC, KC_RALT, MO(WIN_FN),KC_RCTL, KC_LEFT, KC_DOWN, KC_RGHT),
[WIN_FN] = LAYOUT_ansi_82(
KC_TRNS, KC_BRID, KC_BRIU, KC_TASK, KC_FLXP, RGB_VAD, RGB_VAI, KC_MPRV, KC_MPLY, KC_MNXT, KC_MUTE, KC_VOLD, KC_VOLU, KC_TRNS, KC_TRNS,
KC_TRNS, KC_TRNS, KC_TRNS, KC_TRNS, KC_TRNS, KC_TRNS, KC_TRNS, KC_TRNS, KC_TRNS, KC_TRNS, KC_TRNS, KC_TRNS, KC_TRNS, KC_TRNS, KC_TRNS,
RGB_TOG, RGB_MOD, RGB_VAI, RGB_HUI, RGB_SAI, RGB_SPI, KC_TRNS, KC_TRNS, KC_TRNS, KC_TRNS, KC_TRNS, KC_TRNS, KC_TRNS, KC_TRNS, KC_TRNS,
KC_TRNS, RGB_RMOD, RGB_VAD, RGB_HUD, RGB_SAD, RGB_SPD, KC_TRNS, KC_TRNS, KC_TRNS, KC_TRNS, KC_TRNS, KC_TRNS, KC_TRNS, KC_TRNS,
KC_TRNS, KC_TRNS, KC_TRNS, KC_TRNS, KC_TRNS, KC_TRNS, KC_TRNS, KC_TRNS, KC_TRNS, KC_TRNS, KC_TRNS, KC_TRNS, KC_TRNS,
KC_TRNS, KC_TRNS, KC_TRNS, KC_TRNS, KC_TRNS, KC_TRNS, KC_TRNS, KC_TRNS, KC_TRNS, KC_TRNS)
};
#+end_src
If you read this you will understand that the keyboard originally comes with 4
layers. Two for windows and two for Mac. The ~0~ and ~1~ layers are toggled
using a physical switch. The rest are toggled with the ~Fn~ key.
Now let's change the Mac layout to have the ~Function~ keys to be on the main
layer while the media keys to be toggled with the ~Fn~ key. The final version
should look like the following.
#+begin_src c
#include QMK_KEYBOARD_H
enum layers{
MAC_BASE,
MAC_FN,
WIN_BASE,
WIN_FN
};
#define KC_TASK LGUI(KC_TAB)
#define KC_FLXP LGUI(KC_E)
const uint16_t PROGMEM keymaps[][MATRIX_ROWS][MATRIX_COLS] = {
[MAC_BASE] = LAYOUT_ansi_82(
KC_ESC, KC_F1, KC_F2, KC_F3, KC_F4, KC_F5, KC_F6, KC_F7, KC_F8, KC_F9, KC_F10, KC_F11, KC_F12, KC_TRNS, KC_TRNS,
KC_GRV, KC_1, KC_2, KC_3, KC_4, KC_5, KC_6, KC_7, KC_8, KC_9, KC_0, KC_MINS, KC_EQL, KC_BSPC, KC_PGUP,
KC_TAB, KC_Q, KC_W, KC_E, KC_R, KC_T, KC_Y, KC_U, KC_I, KC_O, KC_P, KC_LBRC, KC_RBRC, KC_BSLS, KC_PGDN,
KC_CAPS, KC_A, KC_S, KC_D, KC_F, KC_G, KC_H, KC_J, KC_K, KC_L, KC_SCLN, KC_QUOT, KC_ENT, KC_HOME,
KC_LSFT, KC_Z, KC_X, KC_C, KC_V, KC_B, KC_N, KC_M, KC_COMM, KC_DOT, KC_SLSH, KC_RSFT, KC_UP,
KC_LCTL, KC_LALT, KC_LGUI, KC_SPC, KC_RGUI, MO(MAC_FN),KC_RCTL, KC_LEFT, KC_DOWN, KC_RGHT),
[MAC_FN] = LAYOUT_ansi_82(
KC_TRNS, KC_BRID, KC_BRIU, KC_F3, KC_F4, RGB_VAD, RGB_VAI, KC_MPRV, KC_MPLY, KC_MNXT, KC_MUTE, KC_VOLD, KC_VOLU, KC_DEL, KC_INS,
KC_TRNS, KC_TRNS, KC_TRNS, KC_TRNS, KC_TRNS, KC_TRNS, KC_TRNS, KC_TRNS, KC_TRNS, KC_TRNS, KC_TRNS, KC_TRNS, KC_TRNS, KC_TRNS, KC_TRNS,
RGB_TOG, RGB_MOD, RGB_VAI, RGB_HUI, RGB_SAI, RGB_SPI, KC_TRNS, KC_TRNS, KC_TRNS, KC_TRNS, KC_TRNS, KC_TRNS, KC_TRNS, KC_TRNS, KC_TRNS,
KC_TRNS, RGB_RMOD, RGB_VAD, RGB_HUD, RGB_SAD, RGB_SPD, KC_TRNS, KC_TRNS, KC_TRNS, KC_TRNS, KC_TRNS, KC_TRNS, KC_TRNS, KC_TRNS,
KC_TRNS, KC_TRNS, KC_TRNS, KC_TRNS, KC_TRNS, KC_TRNS, KC_TRNS, KC_TRNS, KC_TRNS, KC_TRNS, KC_TRNS, KC_TRNS, KC_TRNS,
KC_TRNS, KC_TRNS, KC_TRNS, KC_TRNS, KC_TRNS, KC_TRNS, KC_TRNS, KC_TRNS, KC_TRNS, KC_TRNS),
[WIN_BASE] = LAYOUT_ansi_82(
KC_ESC, KC_F1, KC_F2, KC_F3, KC_F4, KC_F5, KC_F6, KC_F7, KC_F8, KC_F9, KC_F10, KC_F11, KC_F12, KC_DEL, KC_INS,
KC_GRV, KC_1, KC_2, KC_3, KC_4, KC_5, KC_6, KC_7, KC_8, KC_9, KC_0, KC_MINS, KC_EQL, KC_BSPC, KC_PGUP,
KC_TAB, KC_Q, KC_W, KC_E, KC_R, KC_T, KC_Y, KC_U, KC_I, KC_O, KC_P, KC_LBRC, KC_RBRC, KC_BSLS, KC_PGDN,
KC_CAPS, KC_A, KC_S, KC_D, KC_F, KC_G, KC_H, KC_J, KC_K, KC_L, KC_SCLN, KC_QUOT, KC_ENT, KC_HOME,
KC_LSFT, KC_Z, KC_X, KC_C, KC_V, KC_B, KC_N, KC_M, KC_COMM, KC_DOT, KC_SLSH, KC_RSFT, KC_UP,
KC_LCTL, KC_LGUI, KC_LALT, KC_SPC, KC_RALT, MO(WIN_FN),KC_RCTL, KC_LEFT, KC_DOWN, KC_RGHT),
[WIN_FN] = LAYOUT_ansi_82(
KC_TRNS, KC_BRID, KC_BRIU, KC_TASK, KC_FLXP, RGB_VAD, RGB_VAI, KC_MPRV, KC_MPLY, KC_MNXT, KC_MUTE, KC_VOLD, KC_VOLU, KC_TRNS, KC_TRNS,
KC_TRNS, KC_TRNS, KC_TRNS, KC_TRNS, KC_TRNS, KC_TRNS, KC_TRNS, KC_TRNS, KC_TRNS, KC_TRNS, KC_TRNS, KC_TRNS, KC_TRNS, KC_TRNS, KC_TRNS,
RGB_TOG, RGB_MOD, RGB_VAI, RGB_HUI, RGB_SAI, RGB_SPI, KC_TRNS, KC_TRNS, KC_TRNS, KC_TRNS, KC_TRNS, KC_TRNS, KC_TRNS, KC_TRNS, KC_TRNS,
KC_TRNS, RGB_RMOD, RGB_VAD, RGB_HUD, RGB_SAD, RGB_SPD, KC_TRNS, KC_TRNS, KC_TRNS, KC_TRNS, KC_TRNS, KC_TRNS, KC_TRNS, KC_TRNS,
KC_TRNS, KC_TRNS, KC_TRNS, KC_TRNS, KC_TRNS, KC_TRNS, KC_TRNS, KC_TRNS, KC_TRNS, KC_TRNS, KC_TRNS, KC_TRNS, KC_TRNS,
KC_TRNS, KC_TRNS, KC_TRNS, KC_TRNS, KC_TRNS, KC_TRNS, KC_TRNS, KC_TRNS, KC_TRNS, KC_TRNS)
};
#+end_src
Now that that's done, we need to compile to check that we didn't forget
anything.
#+begin_src shell
$ qmk compile -kb keychron/q1/rev_0100 -km functions
#+end_src
We seem to have successfully compiled our now keyboard layout.
**** Flashing your keyboard
If you're reached this stage, you'll need to locate the ~reset~ button on your
keyboard. Once located, follow your keyboard's manual on how to *reset* the
board and getting ready it for flashing.
Once the keyboard is ready to be flashed, you basically change one thing in your
previous command.
#+begin_src shell
$ qmk flash -kb keychron/q1/rev_0100 -km functions
#+end_src
If this step succeeds, your keyboard should be ready to use in the newly
configured layout. Check it out !
**** Conclusion
It's pretty awesome to see keyboards like these hit the market. Whether you're
fan of the mechanical switches they come with or not, one thing is certain. You
cannot deny the fact that they are very customisable. If you don't like
something with your keyboard, simply change it. The beauty of it all is that the
firmware is open sourced. The community delivers, yet again !
** Monitoring :@monitoring:
*** DONE Simple cron monitoring with HealthChecks :healthchecks:cron:
:PROPERTIES:
:EXPORT_HUGO_LASTMOD: 2020-02-09
:EXPORT_DATE: 2020-02-09
:EXPORT_FILE_NAME: simple-cron-monitoring-with-healthchecks
:CUSTOM_ID: simple-cron-monitoring-with-healthchecks
:END:
In a previous post entitled "#automating-borg", I showed you how you can automate your *borg* backups with *borgmatic*.
After I started using *borgmatic* for my backups and hooked it to a /cron/ running every 2 hours, I got interested into knowing what's happening to my backups at all times.
My experience comes handy in here, I know I need a monitoring system. I also know that traditional monitoring systems are too complex for my use case.
I need something simple. I need something I can deploy myself.
#+hugo: more
**** Choosing a monitoring system
I already know I don't want a traditional monitoring system like /nagios/ or /sensu/ or /prometheus/. It is not needed, it's an overkill.
I went through the list of hooks that *borgmatic* offers out of the box and checked each project.
I came across https://healthchecks.io/][HealthChecks.
**** HealthChecks
The https://healthchecks.io/][HealthChecks project works in a simple manner.
It simply offers syou an endpoint which you need to ping within a certain period, otherwise you get paged.
It has a lot of integrations from simple emails to other third party services that will call or message you or even trigger push notifications to your phone.
In my case, a simple email is enough. After all, they are simply backups and if they failed now, they will work when cron runs again in 2 hours.
**** Deploy
Let's create a docker-compose service configuration that looks like the
following:
#+BEGIN_SRC yaml
healthchecks:
container_name: healthchecks
image: linuxserver/healthchecks:v1.12.0-ls48
restart: unless-stopped
ports:
- "127.0.0.1:8000:8000"
volumes:
- "./healthchecks/data:/config"
environment:
PUID: "5000"
PGID: "5000"
SECRET_KEY: "super-secret-key"
ALLOWED_HOSTS: '["*"]'
DEBUG: "False"
DEFAULT_FROM_EMAIL: "noreply@healthchecks.example.com"
USE_PAYMENTS: "False"
REGISTRATION_OPEN: "False"
EMAIL_HOST: "smtp.example.com"
EMAIL_PORT: "587"
EMAIL_HOST_USER: "smtp@healthchecks.example.com"
EMAIL_HOST_PASSWORD: "super-secret-password"
EMAIL_USE_TLS: "True"
SITE_ROOT: "https://healthchecks.example.com"
SITE_NAME: "HealthChecks"
MASTER_BADGE_LABEL: "HealthChecks"
PING_ENDPOINT: "https://healthchecks.example.com/ping/"
PING_EMAIL_DOMAIN: "healthchecks.example.com"
TWILIO_ACCOUNT: "None"
TWILIO_AUTH: "None"
TWILIO_FROM: "None"
PD_VENDOR_KEY: "None"
TRELLO_APP_KEY: "None"
#+END_SRC
This will create a docker container exposing it locally on =127.0.0.1:8000=.
Let's point nginx to it and expose it using something similar to the following.
#+BEGIN_EXAMPLE
server {
listen 443 ssl;
server_name healthchecks.example.com;
ssl_certificate /path/to/the/fullchain.pem;
ssl_certificate_key /path/to/the/privkey.pem;
location / {
proxy_pass http://127.0.0.1:8000;
add_header X-Frame-Options SAMEORIGIN;
add_header X-XSS-Protection "1; mode=block";
proxy_redirect off;
proxy_buffering off;
proxy_set_header Host $host;
proxy_set_header X-Real-IP $remote_addr;
proxy_set_header X-Forwarded-For $proxy_add_x_forwarded_for;
proxy_set_header X-Forwarded-Proto $scheme;
proxy_set_header X-Forwarded-Port $server_port;
proxy_read_timeout 90;
}
}
#+END_EXAMPLE
This should do nicely.
**** Usage
Now it's a simple matter of creating a checks.
#+caption: HealthChecks monitoring for BorgBackup
#+attr_html: :target _blank
After this change, all the errors cleared up and got my blog up and
running again.
*** DONE The Story Behind cmw :python:development:
:PROPERTIES:
:EXPORT_HUGO_LASTMOD: 2019-08-31
:EXPORT_DATE: 2019-08-31
:EXPORT_FILE_NAME: the-story-behind-cmw
:CUSTOM_ID: the-story-behind-cmw
:END:
A few days ago, https://kushaldas.in][Kushal Das shared a curl command.
The command was as follows:
#+BEGIN_EXAMPLE
$ curl https://wttr.in/
#+END_EXAMPLE
I, obviously, was curious.
I ran it and it was interesting.
So it returns the weather right ? Pretty cool huh!
#+hugo: more
**** The interest
That got me interested to learn how does this work exactly.
**** The investigation
I looked at https://wttr.in/][https://wttr.in/ and it seemed to have a GitHub https://github.com/chubin/wttr.in][link and a repository.
That is very interesting.
This is a Python application, one can tell by the code or if you prefer the GitHub bar at the top.
Anyway, one can also tell that this is a https://palletsprojects.com/p/flask/][Flask application from the following code in the bin/srv.py.
#+BEGIN_SRC python
from flask import Flask, request, send_from_directory
APP = Flask(__name__)
#+END_SRC
By reading the README.md of the repository one can read.
#+BEGIN_QUOTE
wttr.in uses http://github.com/schachmat/wego][wego for
visualization and various data sources for weather forecast
information.
#+END_QUOTE
Let's jump to the /wego/ repository then.
/wego/ seems to be a command line application to graph the weather in the terminal.
Great, so what I did with https://scm.project42.io/elia/cmw][cmw is already done in Go and API'fied by a different project.
My answer to that accusation is obviously this post.
**** The idea
I played a bit more with https://wttr.in/][https://wttr.in/ and I found it to an interesting API.
I am trying to work on my python development foo so to me that was a perfect little project to work on.
From my perspective this was simply an API and I am to consume it to put it back in my terminal.
**** The work
The beginning work was very rough and hidden away in a private repository and was moved later https://scm.project42.io/elia/cmw][here.
The only thing left from that work is the =--format= argument which allows you full control over what gets sent.
But again, let's not forget what the real purpose of this project was.
So I decided to make the whole API as accessible as possible from the command line tool I am writing.
#+BEGIN_EXAMPLE
$ cmw --help
usage: cmw [-h] [-L LOCATION] [-f FORMAT] [-l LANG] [-m] [-u] [-M] [-z] [-o]
[-w] [-A] [-F] [-n] [-q] [-Q] [-N] [-P] [-p] [-T] [-t TRANSPARENCY]
[--v2] [--version]
Get the weather!
optional arguments:
-h, --help show this help message and exit
-L LOCATION, --location LOCATION
Location (look at epilog for more information)
-f FORMAT, --format FORMAT
Query formatting
-l LANG, --lang LANG The language to use
-m, --metric Units: Metric (SI) (default outside US)
-u, --uscs Units: USCS (default in US)
-M, --meter-second Units: Show wind speed in m/s
-z, --zero View: Only current weather
-o, --one View: Current weather & one day
-w, --two View: Current weather & two days
-A, --ignore-user-agent
View: Force ANSI output format
-F, --follow-link View: Show the 'Follow' line from upstream
-n, --narrow View: Narrow version
-q, --quiet View: Quiet version
-Q, --super-quiet View: Super quiet version
-N, --no-colors View: Switch terminal sequences off
-P, --png PNG: Generate PNG file
-p, --add-frame PNG: Add frame around output
-T, --mid-transparency
PNG: Make transparency 150
-t TRANSPARENCY, --transparency TRANSPARENCY
PNG: Set transparency between 0 and 255
--v2 v2 interface of the day
--version show program's version number and exit
Supported Location Types
------------------------
City name: Paris
Unicode name: Москва
Airport code (3 letters): muc
Domain name: @stackoverflow.com
Area code: 94107
GPS coordinates: -78.46,106.79
Special Location
----------------
Moon phase (add ,+US
or ,+France
for these cities): moon
Moon phase for a date: moon@2016-10-25
Supported languages
-------------------
Supported: af da de el et fr fa hu id it nb nl pl pt-br ro ru tr uk vi
#+END_EXAMPLE
#+BEGIN_EXAMPLE
$ cmw --location London --lang nl --one
Weerbericht voor: London
\ / Zonnig
.-. 20 °C
― ( ) ― → 19 km/h
`-’ 10 km
/ \ 0.0 mm
┌─────────────┐
┌──────────────────────────────┬───────────────────────┤ za 31 aug ├───────────────────────┬──────────────────────────────┐
│ 's Ochtends │ 's Middags └──────┬──────┘ 's Avonds │ 's Nachts │
├──────────────────────────────┼──────────────────────────────┼──────────────────────────────┼──────────────────────────────┤
│ \ / Gedeeltelijk b…│ \ / Gedeeltelijk b…│ Bewolkt │ \ / Gedeeltelijk b…│
│ _ /"".-. 21 °C │ _ /"".-. 23..24 °C │ .--. 20 °C │ _ /"".-. 18 °C │
│ \_( ). ↗ 12-14 km/h │ \_( ). ↗ 18-20 km/h │ .-( ). ↗ 20-25 km/h │ \_( ). → 16-19 km/h │
│ /(___(__) 10 km │ /(___(__) 10 km │ (___.__)__) 10 km │ /(___(__) 10 km │
│ 0.0 mm | 0% │ 0.0 mm | 0% │ 0.0 mm | 0% │ 0.0 mm | 0% │
└──────────────────────────────┴──────────────────────────────┴──────────────────────────────┴──────────────────────────────┘
Locatie: London [51.509648,-0.099076]
#+END_EXAMPLE
**** Conclusion
All I got to say in conclusion is that it was a lot of fun working on https://scm.project42.io/elia/cmw][cmw and I learned a lot.
I'm not going to publish the package on https://pypi.org/][PyPI because seriously, what's the point.
But if you are interested in making changes to the repository, make an MR.
*** DONE QMK Firmware :qmk:firmware:mechanical_keyboard:qmk_firmware:
:PROPERTIES:
:EXPORT_HUGO_LASTMOD: 2021-09-23
:EXPORT_DATE: 2021-09-23
:EXPORT_FILE_NAME: qmk-firmware
:CUSTOM_ID: qmk-firmware
:END:
Over the years, I have owned a few mechanical keyboards. I'm quite fond of them.
I've also built my own keyboard from scratch years ago. Hot-swappable back then
was still in its easy stages and the sockets weren't that good. Alas, we're in
2021 and I've recently purchased the *Keychron Q1* keyboard.
I've chosen this keyboard for many reasons, but the one you most care about is
the topic that brought you here. It's a *QMK Firmware* compatible keyboards. Do
you know what that means ?
That means that we're going to be digging into ~qmk_firmware~. Tag along !
#+hugo: more
**** Quantum Mechanical Keyboard Firmware
The https://github.com/qmk/qmk_firmware][*QMK Firmware* is
#+begin_quote
a keyboard firmware based on the tmk_keyboard firmware with some useful features
for Atmel AVR and ARM controllers, and more specifically, the OLKB product line,
the ErgoDox EZ keyboard, and the Clueboard product line.
#+end_quote
It goes beyond saying, the *QMK Firmware* is open sourced. So let's hack it.
**** Building QMK Firmware
The first step to flashing your keyboard starts here. We need to get the source
code of ~qmk_firmware~ from Github.
#+begin_src shell
$ git clone https://github.com/qmk/qmk_firmware.git
# Wait a while...
# Yup, I know !
# Okay finally...
Cloning into 'qmk_firmware'...
remote: Enumerating objects: 295442, done.
remote: Counting objects: 100% (34/34), done.
remote: Compressing objects: 100% (27/27), done.
remote: Total 295442 (delta 13), reused 17 (delta 5), pack-reused 295408
Receiving objects: 100% (295442/295442), 178.92 MiB | 7.10 MiB/s, done.
Resolving deltas: 100% (178414/178414), done.
Updating files: 100% (27916/27916), done.
$ cd qmk_firmware
#+end_src
Once the repository is clone, we can start with installing the dependencies to
build ~qmk~.
I'm not a big fan of auto-installers or installers scripts
(=util/install/arch.sh=), and here's why.
#+begin_src bash
python3 -m pip install --user -r $QMK_FIRMWARE_DIR/requirements.txt
#+end_src
This is how the installer of the ~qmk_firmware~ concludes the round. I would
hate to use pip to install willy nilly like that.
Otherwise, I don't have objections to what it does on ~arch~ at least.
It does the following, I see no reason not to follow it.
#+begin_src shell
$ sudo pacman -S \
base-devel clang diffutils gcc git unzip wget zip python-pip \
avr-binutils arm-none-eabi-binutils arm-none-eabi-gcc \
arm-none-eabi-newlib avrdude dfu-programmer dfu-util
$ sudo pacman -U https://archive.archlinux.org/packages/a/avr-gcc/avr-gcc-8.3.0-1-x86_64.pkg.tar.xz
$ sudo pacman -S avr-libc # Must be installed after the above, or it will bring in the latest avr-gcc instead
$ sudo pacman -S hidapi # This will fail if the community repo isn't enabled
#+end_src
Now that all the dependencies required by the system are installed, let's
install the ~python~ dependencies.
#+begin_src shell
$ git checkout 0.14.9 # Checkout the latest version
$ vf new qmk_firmware # Create a new python virtualenv and activate it
$ pip install -r requirements.txt # Install python requirements
$ pip install qmk
$ make git-submodule
#+end_src
Finally, we can build our keyboard firmware.
#+begin_src bash
$ qmk compile -kb keychron/q1/rev_0100 -km default
Ψ Compiling keymap with make --jobs=1 keychron/q1/rev_0100:default [31/494]
QMK Firmware 0.14.16
Making keychron/q1/rev_0100 with keymap default
avr-gcc (GCC) 11.2.0
Copyright (C) 2021 Free Software Foundation, Inc.
This is free software; see the source for copying conditions. There is NO
warranty; not even for MERCHANTABILITY or FITNESS FOR A PARTICULAR PURPOSE.
Compiling: keyboards/keychron/q1/q1.c [OK]
Compiling: keyboards/keychron/q1/rev_0100/rev_0100.c [OK]
Compiling: keyboards/keychron/q1/rev_0100/keymaps/default/keymap.c [OK]
Compiling: quantum/quantum.c [OK]
Compiling: quantum/send_string.c [OK]
Compiling: quantum/bitwise.c [OK]
Compiling: quantum/led.c [OK]
Compiling: quantum/action.c [OK]
Compiling: quantum/action_layer.c [OK]
Compiling: quantum/action_macro.c [OK]
Compiling: quantum/action_tapping.c [OK]
Compiling: quantum/action_util.c [OK]
Compiling: quantum/eeconfig.c [OK]
Compiling: quantum/keyboard.c [OK]
Compiling: quantum/keymap_common.c [OK]
Compiling: quantum/keycode_config.c [OK]
Compiling: quantum/logging/debug.c [OK]
Compiling: quantum/logging/sendchar.c [OK]
Compiling: quantum/bootmagic/bootmagic_lite.c [OK]
Compiling: quantum/bootmagic/magic.c [OK]
Compiling: quantum/matrix_common.c [OK]
Compiling: quantum/matrix.c [OK]
Compiling: quantum/debounce/sym_defer_g.c [OK]
Compiling: quantum/main.c [OK]
Compiling: quantum/color.c [OK]
Compiling: quantum/rgb_matrix/rgb_matrix.c [OK]
Compiling: quantum/rgb_matrix/rgb_matrix_drivers.c [OK]
Compiling: lib/lib8tion/lib8tion.c [OK]
Compiling: drivers/led/issi/is31fl3733.c [OK]
Compiling: quantum/process_keycode/process_rgb.c [OK]
Compiling: quantum/led_tables.c [OK]
Compiling: quantum/dip_switch.c [OK]
Compiling: quantum/process_keycode/process_space_cadet.c [OK]
Compiling: quantum/process_keycode/process_magic.c [OK]
Compiling: quantum/process_keycode/process_grave_esc.c [OK]
Compiling: platforms/avr/drivers/i2c_master.c [OK]
Archiving: .build/obj_keychron_q1_rev_0100_default/i2c_master.o [OK]
Compiling: tmk_core/common/host.c [OK]
Compiling: tmk_core/common/report.c [OK]
Compiling: tmk_core/common/sync_timer.c [OK]
Compiling: tmk_core/common/usb_util.c [OK]
Compiling: tmk_core/common/avr/platform.c [OK]
Compiling: tmk_core/common/avr/suspend.c [OK]
Compiling: tmk_core/common/avr/timer.c [OK]
Compiling: tmk_core/common/avr/bootloader.c [OK]
Assembling: tmk_core/common/avr/xprintf.S [OK]
Compiling: tmk_core/common/avr/printf.c [OK]
Compiling: tmk_core/protocol/lufa/lufa.c [OK]
Compiling: tmk_core/protocol/usb_descriptor.c [OK]
Compiling: lib/lufa/LUFA/Drivers/USB/Class/Common/HIDParser.c [OK]
Compiling: lib/lufa/LUFA/Drivers/USB/Core/AVR8/Device_AVR8.c [OK]
Compiling: lib/lufa/LUFA/Drivers/USB/Core/AVR8/EndpointStream_AVR8.c [OK]
Compiling: lib/lufa/LUFA/Drivers/USB/Core/AVR8/Endpoint_AVR8.c [OK]
Compiling: lib/lufa/LUFA/Drivers/USB/Core/AVR8/Host_AVR8.c [OK]
Compiling: lib/lufa/LUFA/Drivers/USB/Core/AVR8/PipeStream_AVR8.c [OK]
Compiling: lib/lufa/LUFA/Drivers/USB/Core/AVR8/Pipe_AVR8.c [OK]
Compiling: lib/lufa/LUFA/Drivers/USB/Core/AVR8/USBController_AVR8.c [OK]
Compiling: lib/lufa/LUFA/Drivers/USB/Core/AVR8/USBInterrupt_AVR8.c [OK]
Compiling: lib/lufa/LUFA/Drivers/USB/Core/ConfigDescriptors.c [OK]
Compiling: lib/lufa/LUFA/Drivers/USB/Core/DeviceStandardReq.c [OK]
Compiling: lib/lufa/LUFA/Drivers/USB/Core/Events.c [OK]
Compiling: lib/lufa/LUFA/Drivers/USB/Core/HostStandardReq.c [OK]
Compiling: lib/lufa/LUFA/Drivers/USB/Core/USBTask.c [OK]
Compiling: tmk_core/protocol/lufa/usb_util.c [OK]
Linking: .build/keychron_q1_rev_0100_default.elf [OK]
Creating load file for flashing: .build/keychron_q1_rev_0100_default.hex [OK]
Copying keychron_q1_rev_0100_default.hex to qmk_firmware folder [OK]
Checking file size of keychron_q1_rev_0100_default.hex [OK]
* The firmware size is fine - 23302/28672 (81%, 5370 bytes free)
#+end_src
Look at tha, easy as pie ! You got yourself a compiled firmware.
Before we move on, let's look at the command again and figure out what the hell
I did, just in case you're running a different keyboard.
If you look into the =keyboards/=, you'll be able to find a big list of
keyboards supported. The =keychron/q1/rev_0100= is simply a directory in there
that matches my keyboard. Inside that directory, we can find the =keymaps/=
directory. This is where all the keymaps live. We chose the ~default~ keymap
which is a directory in there as well.
**** Remapping the keyboard
At this stage, we were able to succesfully compile the keyboard firmware. But
the whole point of this is to modify the layout of the keyboard so let's go
right ahead.
There are commands suggested on the ~QMK~ docs but I didn't go that far, I
simply copied the =default= directory and went down to business. For the sake of
this blog post, I'll assume I called the directory =functions=.
The =keymap.c= file looks as follows.
#+begin_src c
#include QMK_KEYBOARD_H
enum layers{
MAC_BASE,
MAC_FN,
WIN_BASE,
WIN_FN
};
#define KC_TASK LGUI(KC_TAB)
#define KC_FLXP LGUI(KC_E)
const uint16_t PROGMEM keymaps[][MATRIX_ROWS][MATRIX_COLS] = {
[MAC_BASE] = LAYOUT_ansi_82(
KC_ESC, KC_BRID, KC_BRIU, KC_F3, KC_F4, RGB_VAD, RGB_VAI, KC_MPRV, KC_MPLY, KC_MNXT, KC_MUTE, KC_VOLD, KC_VOLU, KC_DEL, KC_INS,
KC_GRV, KC_1, KC_2, KC_3, KC_4, KC_5, KC_6, KC_7, KC_8, KC_9, KC_0, KC_MINS, KC_EQL, KC_BSPC, KC_PGUP,
KC_TAB, KC_Q, KC_W, KC_E, KC_R, KC_T, KC_Y, KC_U, KC_I, KC_O, KC_P, KC_LBRC, KC_RBRC, KC_BSLS, KC_PGDN,
KC_CAPS, KC_A, KC_S, KC_D, KC_F, KC_G, KC_H, KC_J, KC_K, KC_L, KC_SCLN, KC_QUOT, KC_ENT, KC_HOME,
KC_LSFT, KC_Z, KC_X, KC_C, KC_V, KC_B, KC_N, KC_M, KC_COMM, KC_DOT, KC_SLSH, KC_RSFT, KC_UP,
KC_LCTL, KC_LALT, KC_LGUI, KC_SPC, KC_RGUI, MO(MAC_FN),KC_RCTL, KC_LEFT, KC_DOWN, KC_RGHT),
[MAC_FN] = LAYOUT_ansi_82(
KC_TRNS, KC_F1, KC_F2, KC_F3, KC_F4, KC_F5, KC_F6, KC_F7, KC_F8, KC_F9, KC_F10, KC_F11, KC_F12, KC_TRNS, KC_TRNS,
KC_TRNS, KC_TRNS, KC_TRNS, KC_TRNS, KC_TRNS, KC_TRNS, KC_TRNS, KC_TRNS, KC_TRNS, KC_TRNS, KC_TRNS, KC_TRNS, KC_TRNS, KC_TRNS, KC_TRNS,
RGB_TOG, RGB_MOD, RGB_VAI, RGB_HUI, RGB_SAI, RGB_SPI, KC_TRNS, KC_TRNS, KC_TRNS, KC_TRNS, KC_TRNS, KC_TRNS, KC_TRNS, KC_TRNS, KC_TRNS,
KC_TRNS, RGB_RMOD, RGB_VAD, RGB_HUD, RGB_SAD, RGB_SPD, KC_TRNS, KC_TRNS, KC_TRNS, KC_TRNS, KC_TRNS, KC_TRNS, KC_TRNS, KC_TRNS,
KC_TRNS, KC_TRNS, KC_TRNS, KC_TRNS, KC_TRNS, KC_TRNS, KC_TRNS, KC_TRNS, KC_TRNS, KC_TRNS, KC_TRNS, KC_TRNS, KC_TRNS,
KC_TRNS, KC_TRNS, KC_TRNS, KC_TRNS, KC_TRNS, KC_TRNS, KC_TRNS, KC_TRNS, KC_TRNS, KC_TRNS),
[WIN_BASE] = LAYOUT_ansi_82(
KC_ESC, KC_F1, KC_F2, KC_F3, KC_F4, KC_F5, KC_F6, KC_F7, KC_F8, KC_F9, KC_F10, KC_F11, KC_F12, KC_DEL, KC_INS,
KC_GRV, KC_1, KC_2, KC_3, KC_4, KC_5, KC_6, KC_7, KC_8, KC_9, KC_0, KC_MINS, KC_EQL, KC_BSPC, KC_PGUP,
KC_TAB, KC_Q, KC_W, KC_E, KC_R, KC_T, KC_Y, KC_U, KC_I, KC_O, KC_P, KC_LBRC, KC_RBRC, KC_BSLS, KC_PGDN,
KC_CAPS, KC_A, KC_S, KC_D, KC_F, KC_G, KC_H, KC_J, KC_K, KC_L, KC_SCLN, KC_QUOT, KC_ENT, KC_HOME,
KC_LSFT, KC_Z, KC_X, KC_C, KC_V, KC_B, KC_N, KC_M, KC_COMM, KC_DOT, KC_SLSH, KC_RSFT, KC_UP,
KC_LCTL, KC_LGUI, KC_LALT, KC_SPC, KC_RALT, MO(WIN_FN),KC_RCTL, KC_LEFT, KC_DOWN, KC_RGHT),
[WIN_FN] = LAYOUT_ansi_82(
KC_TRNS, KC_BRID, KC_BRIU, KC_TASK, KC_FLXP, RGB_VAD, RGB_VAI, KC_MPRV, KC_MPLY, KC_MNXT, KC_MUTE, KC_VOLD, KC_VOLU, KC_TRNS, KC_TRNS,
KC_TRNS, KC_TRNS, KC_TRNS, KC_TRNS, KC_TRNS, KC_TRNS, KC_TRNS, KC_TRNS, KC_TRNS, KC_TRNS, KC_TRNS, KC_TRNS, KC_TRNS, KC_TRNS, KC_TRNS,
RGB_TOG, RGB_MOD, RGB_VAI, RGB_HUI, RGB_SAI, RGB_SPI, KC_TRNS, KC_TRNS, KC_TRNS, KC_TRNS, KC_TRNS, KC_TRNS, KC_TRNS, KC_TRNS, KC_TRNS,
KC_TRNS, RGB_RMOD, RGB_VAD, RGB_HUD, RGB_SAD, RGB_SPD, KC_TRNS, KC_TRNS, KC_TRNS, KC_TRNS, KC_TRNS, KC_TRNS, KC_TRNS, KC_TRNS,
KC_TRNS, KC_TRNS, KC_TRNS, KC_TRNS, KC_TRNS, KC_TRNS, KC_TRNS, KC_TRNS, KC_TRNS, KC_TRNS, KC_TRNS, KC_TRNS, KC_TRNS,
KC_TRNS, KC_TRNS, KC_TRNS, KC_TRNS, KC_TRNS, KC_TRNS, KC_TRNS, KC_TRNS, KC_TRNS, KC_TRNS)
};
#+end_src
If you read this you will understand that the keyboard originally comes with 4
layers. Two for windows and two for Mac. The ~0~ and ~1~ layers are toggled
using a physical switch. The rest are toggled with the ~Fn~ key.
Now let's change the Mac layout to have the ~Function~ keys to be on the main
layer while the media keys to be toggled with the ~Fn~ key. The final version
should look like the following.
#+begin_src c
#include QMK_KEYBOARD_H
enum layers{
MAC_BASE,
MAC_FN,
WIN_BASE,
WIN_FN
};
#define KC_TASK LGUI(KC_TAB)
#define KC_FLXP LGUI(KC_E)
const uint16_t PROGMEM keymaps[][MATRIX_ROWS][MATRIX_COLS] = {
[MAC_BASE] = LAYOUT_ansi_82(
KC_ESC, KC_F1, KC_F2, KC_F3, KC_F4, KC_F5, KC_F6, KC_F7, KC_F8, KC_F9, KC_F10, KC_F11, KC_F12, KC_TRNS, KC_TRNS,
KC_GRV, KC_1, KC_2, KC_3, KC_4, KC_5, KC_6, KC_7, KC_8, KC_9, KC_0, KC_MINS, KC_EQL, KC_BSPC, KC_PGUP,
KC_TAB, KC_Q, KC_W, KC_E, KC_R, KC_T, KC_Y, KC_U, KC_I, KC_O, KC_P, KC_LBRC, KC_RBRC, KC_BSLS, KC_PGDN,
KC_CAPS, KC_A, KC_S, KC_D, KC_F, KC_G, KC_H, KC_J, KC_K, KC_L, KC_SCLN, KC_QUOT, KC_ENT, KC_HOME,
KC_LSFT, KC_Z, KC_X, KC_C, KC_V, KC_B, KC_N, KC_M, KC_COMM, KC_DOT, KC_SLSH, KC_RSFT, KC_UP,
KC_LCTL, KC_LALT, KC_LGUI, KC_SPC, KC_RGUI, MO(MAC_FN),KC_RCTL, KC_LEFT, KC_DOWN, KC_RGHT),
[MAC_FN] = LAYOUT_ansi_82(
KC_TRNS, KC_BRID, KC_BRIU, KC_F3, KC_F4, RGB_VAD, RGB_VAI, KC_MPRV, KC_MPLY, KC_MNXT, KC_MUTE, KC_VOLD, KC_VOLU, KC_DEL, KC_INS,
KC_TRNS, KC_TRNS, KC_TRNS, KC_TRNS, KC_TRNS, KC_TRNS, KC_TRNS, KC_TRNS, KC_TRNS, KC_TRNS, KC_TRNS, KC_TRNS, KC_TRNS, KC_TRNS, KC_TRNS,
RGB_TOG, RGB_MOD, RGB_VAI, RGB_HUI, RGB_SAI, RGB_SPI, KC_TRNS, KC_TRNS, KC_TRNS, KC_TRNS, KC_TRNS, KC_TRNS, KC_TRNS, KC_TRNS, KC_TRNS,
KC_TRNS, RGB_RMOD, RGB_VAD, RGB_HUD, RGB_SAD, RGB_SPD, KC_TRNS, KC_TRNS, KC_TRNS, KC_TRNS, KC_TRNS, KC_TRNS, KC_TRNS, KC_TRNS,
KC_TRNS, KC_TRNS, KC_TRNS, KC_TRNS, KC_TRNS, KC_TRNS, KC_TRNS, KC_TRNS, KC_TRNS, KC_TRNS, KC_TRNS, KC_TRNS, KC_TRNS,
KC_TRNS, KC_TRNS, KC_TRNS, KC_TRNS, KC_TRNS, KC_TRNS, KC_TRNS, KC_TRNS, KC_TRNS, KC_TRNS),
[WIN_BASE] = LAYOUT_ansi_82(
KC_ESC, KC_F1, KC_F2, KC_F3, KC_F4, KC_F5, KC_F6, KC_F7, KC_F8, KC_F9, KC_F10, KC_F11, KC_F12, KC_DEL, KC_INS,
KC_GRV, KC_1, KC_2, KC_3, KC_4, KC_5, KC_6, KC_7, KC_8, KC_9, KC_0, KC_MINS, KC_EQL, KC_BSPC, KC_PGUP,
KC_TAB, KC_Q, KC_W, KC_E, KC_R, KC_T, KC_Y, KC_U, KC_I, KC_O, KC_P, KC_LBRC, KC_RBRC, KC_BSLS, KC_PGDN,
KC_CAPS, KC_A, KC_S, KC_D, KC_F, KC_G, KC_H, KC_J, KC_K, KC_L, KC_SCLN, KC_QUOT, KC_ENT, KC_HOME,
KC_LSFT, KC_Z, KC_X, KC_C, KC_V, KC_B, KC_N, KC_M, KC_COMM, KC_DOT, KC_SLSH, KC_RSFT, KC_UP,
KC_LCTL, KC_LGUI, KC_LALT, KC_SPC, KC_RALT, MO(WIN_FN),KC_RCTL, KC_LEFT, KC_DOWN, KC_RGHT),
[WIN_FN] = LAYOUT_ansi_82(
KC_TRNS, KC_BRID, KC_BRIU, KC_TASK, KC_FLXP, RGB_VAD, RGB_VAI, KC_MPRV, KC_MPLY, KC_MNXT, KC_MUTE, KC_VOLD, KC_VOLU, KC_TRNS, KC_TRNS,
KC_TRNS, KC_TRNS, KC_TRNS, KC_TRNS, KC_TRNS, KC_TRNS, KC_TRNS, KC_TRNS, KC_TRNS, KC_TRNS, KC_TRNS, KC_TRNS, KC_TRNS, KC_TRNS, KC_TRNS,
RGB_TOG, RGB_MOD, RGB_VAI, RGB_HUI, RGB_SAI, RGB_SPI, KC_TRNS, KC_TRNS, KC_TRNS, KC_TRNS, KC_TRNS, KC_TRNS, KC_TRNS, KC_TRNS, KC_TRNS,
KC_TRNS, RGB_RMOD, RGB_VAD, RGB_HUD, RGB_SAD, RGB_SPD, KC_TRNS, KC_TRNS, KC_TRNS, KC_TRNS, KC_TRNS, KC_TRNS, KC_TRNS, KC_TRNS,
KC_TRNS, KC_TRNS, KC_TRNS, KC_TRNS, KC_TRNS, KC_TRNS, KC_TRNS, KC_TRNS, KC_TRNS, KC_TRNS, KC_TRNS, KC_TRNS, KC_TRNS,
KC_TRNS, KC_TRNS, KC_TRNS, KC_TRNS, KC_TRNS, KC_TRNS, KC_TRNS, KC_TRNS, KC_TRNS, KC_TRNS)
};
#+end_src
Now that that's done, we need to compile to check that we didn't forget
anything.
#+begin_src shell
$ qmk compile -kb keychron/q1/rev_0100 -km functions
#+end_src
We seem to have successfully compiled our now keyboard layout.
**** Flashing your keyboard
If you're reached this stage, you'll need to locate the ~reset~ button on your
keyboard. Once located, follow your keyboard's manual on how to *reset* the
board and getting ready it for flashing.
Once the keyboard is ready to be flashed, you basically change one thing in your
previous command.
#+begin_src shell
$ qmk flash -kb keychron/q1/rev_0100 -km functions
#+end_src
If this step succeeds, your keyboard should be ready to use in the newly
configured layout. Check it out !
**** Conclusion
It's pretty awesome to see keyboards like these hit the market. Whether you're
fan of the mechanical switches they come with or not, one thing is certain. You
cannot deny the fact that they are very customisable. If you don't like
something with your keyboard, simply change it. The beauty of it all is that the
firmware is open sourced. The community delivers, yet again !
** Monitoring :@monitoring:
*** DONE Simple cron monitoring with HealthChecks :healthchecks:cron:
:PROPERTIES:
:EXPORT_HUGO_LASTMOD: 2020-02-09
:EXPORT_DATE: 2020-02-09
:EXPORT_FILE_NAME: simple-cron-monitoring-with-healthchecks
:CUSTOM_ID: simple-cron-monitoring-with-healthchecks
:END:
In a previous post entitled "#automating-borg", I showed you how you can automate your *borg* backups with *borgmatic*.
After I started using *borgmatic* for my backups and hooked it to a /cron/ running every 2 hours, I got interested into knowing what's happening to my backups at all times.
My experience comes handy in here, I know I need a monitoring system. I also know that traditional monitoring systems are too complex for my use case.
I need something simple. I need something I can deploy myself.
#+hugo: more
**** Choosing a monitoring system
I already know I don't want a traditional monitoring system like /nagios/ or /sensu/ or /prometheus/. It is not needed, it's an overkill.
I went through the list of hooks that *borgmatic* offers out of the box and checked each project.
I came across https://healthchecks.io/][HealthChecks.
**** HealthChecks
The https://healthchecks.io/][HealthChecks project works in a simple manner.
It simply offers syou an endpoint which you need to ping within a certain period, otherwise you get paged.
It has a lot of integrations from simple emails to other third party services that will call or message you or even trigger push notifications to your phone.
In my case, a simple email is enough. After all, they are simply backups and if they failed now, they will work when cron runs again in 2 hours.
**** Deploy
Let's create a docker-compose service configuration that looks like the
following:
#+BEGIN_SRC yaml
healthchecks:
container_name: healthchecks
image: linuxserver/healthchecks:v1.12.0-ls48
restart: unless-stopped
ports:
- "127.0.0.1:8000:8000"
volumes:
- "./healthchecks/data:/config"
environment:
PUID: "5000"
PGID: "5000"
SECRET_KEY: "super-secret-key"
ALLOWED_HOSTS: '["*"]'
DEBUG: "False"
DEFAULT_FROM_EMAIL: "noreply@healthchecks.example.com"
USE_PAYMENTS: "False"
REGISTRATION_OPEN: "False"
EMAIL_HOST: "smtp.example.com"
EMAIL_PORT: "587"
EMAIL_HOST_USER: "smtp@healthchecks.example.com"
EMAIL_HOST_PASSWORD: "super-secret-password"
EMAIL_USE_TLS: "True"
SITE_ROOT: "https://healthchecks.example.com"
SITE_NAME: "HealthChecks"
MASTER_BADGE_LABEL: "HealthChecks"
PING_ENDPOINT: "https://healthchecks.example.com/ping/"
PING_EMAIL_DOMAIN: "healthchecks.example.com"
TWILIO_ACCOUNT: "None"
TWILIO_AUTH: "None"
TWILIO_FROM: "None"
PD_VENDOR_KEY: "None"
TRELLO_APP_KEY: "None"
#+END_SRC
This will create a docker container exposing it locally on =127.0.0.1:8000=.
Let's point nginx to it and expose it using something similar to the following.
#+BEGIN_EXAMPLE
server {
listen 443 ssl;
server_name healthchecks.example.com;
ssl_certificate /path/to/the/fullchain.pem;
ssl_certificate_key /path/to/the/privkey.pem;
location / {
proxy_pass http://127.0.0.1:8000;
add_header X-Frame-Options SAMEORIGIN;
add_header X-XSS-Protection "1; mode=block";
proxy_redirect off;
proxy_buffering off;
proxy_set_header Host $host;
proxy_set_header X-Real-IP $remote_addr;
proxy_set_header X-Forwarded-For $proxy_add_x_forwarded_for;
proxy_set_header X-Forwarded-Proto $scheme;
proxy_set_header X-Forwarded-Port $server_port;
proxy_read_timeout 90;
}
}
#+END_EXAMPLE
This should do nicely.
**** Usage
Now it's a simple matter of creating a checks.
#+caption: HealthChecks monitoring for BorgBackup
#+attr_html: :target _blank
![file:images/simple-cron-monitoring-with-healthchecks/borgbackup-healthchecks.png][file:images/simple-cron-monitoring-with-healthchecks/borgbackup-healthchecks.png](file:images/simple-cron-monitoring-with-healthchecks/borgbackup-healthchecks.png][file:images/simple-cron-monitoring-with-healthchecks/borgbackup-healthchecks.png "borgbackup-healthchecks.png") This will give you a link that looks like the following
#+BEGIN_EXAMPLE
https://healthchecks.example.com/ping/84b2a834-02f5-524f-4c27-a2f24562b219
#+END_EXAMPLE
Let's feed it to *borgmatic*.
#+BEGIN_SRC yaml
hooks:
healthchecks: https://healthchecks.example.com/ping/84b2a834-02f5-524f-4c27-a2f24562b219
#+END_SRC
After you configure the *borgmatic* hook to keep /HealthChecks/ in the know of what's going on.
We can take a look at the log to see what happened and when.
#+caption: HealthChecks monitoring for BorgBackup
#+attr_html: :target _blank
This will give you a link that looks like the following
#+BEGIN_EXAMPLE
https://healthchecks.example.com/ping/84b2a834-02f5-524f-4c27-a2f24562b219
#+END_EXAMPLE
Let's feed it to *borgmatic*.
#+BEGIN_SRC yaml
hooks:
healthchecks: https://healthchecks.example.com/ping/84b2a834-02f5-524f-4c27-a2f24562b219
#+END_SRC
After you configure the *borgmatic* hook to keep /HealthChecks/ in the know of what's going on.
We can take a look at the log to see what happened and when.
#+caption: HealthChecks monitoring for BorgBackup
#+attr_html: :target _blank
![file:images/simple-cron-monitoring-with-healthchecks/borgbackup-healthchecks-logs.png][file:images/simple-cron-monitoring-with-healthchecks/borgbackup-healthchecks-logs.png](file:images/simple-cron-monitoring-with-healthchecks/borgbackup-healthchecks-logs.png][file:images/simple-cron-monitoring-with-healthchecks/borgbackup-healthchecks-logs.png "borgbackup-healthchecks-logs.png") **** Conclusion
As we saw in the blog post, now I am always in the know about my backups.
If my backup fails, I get an email to notify me of a failure.
I can also monitor how much time it takes my backups to run.
This is a very important feature for me to have.
The question of deploying one's own monitoring system is a personal choice.
After all, one can use free third party services if they would like.
The correct answer though is to always monitor.
*** DONE Building up simple monitoring on Healthchecks :healthchecks:cron:curl:
:PROPERTIES:
:EXPORT_HUGO_LASTMOD: 2020-02-11
:EXPORT_DATE: 2020-02-11
:EXPORT_FILE_NAME: building-up-simple-monitoring-on-healthchecks
:CUSTOM_ID: building-up-simple-monitoring-on-healthchecks
:END:
I talked previously in "#simple-cron-monitoring-with-healthchecks" about deploying my own simple monitoring system.
Now that it's up, I'm only using it for my backups. That's a good use, for sure, but I know I can do better.
So I went digging.
#+hugo: more
**** Introduction
I host a list of services, some are public like my blog while others private.
These services are not critical, some can be down for short periods of time.
Some services might even be down for longer periods without causing any loss in functionality.
That being said, I'm a /DevOps engineer/. That means, I need to know.
Yea, it doesn't mean I'll do something about it right away, but I'd like to be in the know.
Which got me thinking...
**** Healthchecks Endpoints
Watching *borg* use its /healthchecks/ hook opened my eyes on another functionality of *Healthchecks*.
It seems that if you ping
#+BEGIN_EXAMPLE
https://healthchecks.example.com/ping/84b2a834-02f5-524f-4c27-a2f24562b219/start
#+END_EXAMPLE
It will start a counter that will measure the time until you ping
#+BEGIN_EXAMPLE
https://healthchecks.example.com/ping/84b2a834-02f5-524f-4c27-a2f24562b219
#+END_EXAMPLE
This way, you can find out how long it is taking you to check on the status of a service. Or maybe, how long a service is taking to backup.
It turns out that /healthchecks/ also offers a different endpoint to ping. You can report a failure straight away by pinging
#+BEGIN_EXAMPLE
https://healthchecks.example.com/ping/84b2a834-02f5-524f-4c27-a2f24562b219/fail
#+END_EXAMPLE
This way, you do not have to wait until the time expires before you get notified of a failure.
With those pieces of knowledge, we can do a lot.
**** A lot ?
Yes, a lot...
Let's put what we have learned so far into action.
#+BEGIN_SRC sh :noeval
#!/bin/bash
WEB_HOST=$1
CHECK_ID=$2
HEALTHCHECKS_HOST="https://healthchecks.example.com/ping"
curl -fsS --retry 3 "${HEALTHCHECKS_HOST}/${CHECK_ID}/start" > /dev/null
OUTPUT=`curl -sS "${WEB_HOST}"`
STATUS=$?
if $STATUS -eq 0 ; then
curl -fsS --retry 3 "${HEALTHCHECKS_HOST}/${CHECK_ID}" > /dev/null
else
curl -fsS --retry 3 "${HEALTHCHECKS_HOST}/${CHECK_ID}/fail" > /dev/null
fi
#+END_SRC
We start by defining a few variables for the website hostname to monitor, the check ID provided by /healthchecks/ and finally the /healthchecks/ base link for the monitors.
Once those are set, we simply use =curl= with a couple of special flags to make sure that it fails properly if something goes wrong.
We start the /healthchecks/ timer, run the website check and either call the passing or the failing /healthchecks/ endpoint depending on the outcomes.
#+BEGIN_EXAMPLE
$ chmod +x https_healthchecks_monitor.sh
$ ./https_healthchecks_monitor.sh https://healthchecks.example.com 84b2a834-02f5-524f-4c27-a2f24562b219
#+END_EXAMPLE
Test it out.
**** Okay, that's nice but now what !
Now, let's hook it up to our cron.
Start with =crontab -e= which should open your favorite text editor.
Then create a cron entry (a new line) like the following:
#+BEGIN_EXAMPLE
*/15 * * * * /path/to/https_healthchecks_monitor.sh https://healthchecks.example.com 84b2a834-02f5-524f-4c27-a2f24562b219
#+END_EXAMPLE
This will run the script every 15 minutes. Make sure that your timeout is 15 minutes for this check, with a grace period of 5 minutes.
That configuration will guarantee that you will get notified 20 minutes after any failure, at the worst.
Be aware, I said any failure.
Getting notified does not guarantee that your website is down.
It can only guarantee that /healthchecks/ wasn't pinged on time.
Getting notified covers a bunch of cases. Some of them are:
- The server running the cron is down
- The cron services is not running
- The server running the cron lost internet access
- Your certificate expired
- Your website is down
You can create checks to cover most of these if you care to make it a full monitoring system.
If you want to go that far, maybe you should invest in a monitoring system with more features.
**** Conclusion
Don't judge something by its simplicity. Somethings, out of simple components tied together you can make something interesting and useful.
With a little of scripting, couple of commands and the power of cron we were able to make /healthchecks/ monitor our websites.
*** DONE Upgrade your monitoring setup with Prometheus :prometheus:metrics:container:
:PROPERTIES:
:EXPORT_HUGO_LASTMOD: 2021-09-17
:EXPORT_DATE: 2021-09-17
:EXPORT_FILE_NAME: upgrade-your-monitoring-setup-with-prometheus
:CUSTOM_ID: upgrade-your-monitoring-setup-with-prometheus
:END:
After running simple monitoring for quite a while, I decided to upgrade my
setup. It is about time to get some real metric gathering to see what's going
on. It's also time to get some proper monitoring setup.
There are a lot of options in this field and I should, probably, write a blog
post on my views on the topic. For this experiment, on the other hand, the
solution is already pre-chosen. We'll be running Prometheus.
#+hugo: more
**** Prometheus
To answer the question, /what is Prometheus?/, we'll rip a page out of the
Prometheus https://prometheus.io/docs/introduction/overview/][docs.
#+begin_quote
Prometheus is an open-source systems monitoring and alerting toolkit originally
built at SoundCloud. Since its inception in 2012, many companies and
organizations have adopted Prometheus, and the project has a very active
developer and user community. It is now a standalone open source project and
maintained independently of any company. To emphasize this, and to clarify the
project's governance structure, Prometheus joined the Cloud Native Computing
Foundation in 2016 as the second hosted project, after Kubernetes.
Prometheus collects and stores its metrics as time series data, i.e. metrics
information is stored with the timestamp at which it was recorded, alongside
optional key-value pairs called labels.
#+end_quote
let's decypher all this jargon down to plain English. In simple terms,
Prometheus is a system that scrape metrics, from your services and applications,
and stores those metrics, in a time series database, ready to serve back again
when queried.
Prometheus also offers a way to create rules on those metrics to alert you when
something goes wrong. Combined with https://prometheus.io/docs/alerting/latest/alertmanager/][/Alertmanager/, you got yourself a full
monitoring system.
**** Configuration
Now that we briefly touched on a /few/ features of *Prometheus* and before we
can deploy, we need to write our configuration.
This is an example of a bare configuration.
#+NAME: prometheus-scraping-config
#+begin_src yaml
scrape_configs:
- job_name: prometheus
scrape_interval: 30s
static_configs:
- targets:
- prometheus:9090
#+end_src
This will make Prometheus scrape itself every 30 seconds for metrics. At least
you get /some/ metrics to query later. If you want the full experience, I would
suggest you enable /Prometheus metrics/ for your services. Consult the docs of
the project to see if and how it can expose metrics for /Prometheus/ to scrape,
then add the scrape endpoint to your configuration as shown above.
Here's a an example of a couple more, /well known/, projects; https://prometheus.io/docs/alerting/latest/alertmanager/][/Alertmanager/ and
https://github.com/prometheus/node_exporter][/node exporter/.
#+NAME: prometheus-example-scraping-config
#+begin_src yaml
- job_name: alertmanager
scrape_interval: 30s
static_configs:
- targets:
- alertmanager:9093
- job_name: node-exporter
scrape_interval: 30s
static_configs:
- targets:
- node-exporter:9100
#+end_src
A wider https://prometheus.io/docs/instrumenting/exporters/][list of exporters can be found on the Prometheus docs.
**** Deployment
Now that we got ourselves a cofniguration, let's deploy *Prometheus*.
Luckily for us, Prometheus comes containerized and ready to deploy. We'll be
using =docker-compose= in this example to make it easier to translate later to
other types of deployments.
#+BEGIN_EXPORT html
**** Conclusion
As we saw in the blog post, now I am always in the know about my backups.
If my backup fails, I get an email to notify me of a failure.
I can also monitor how much time it takes my backups to run.
This is a very important feature for me to have.
The question of deploying one's own monitoring system is a personal choice.
After all, one can use free third party services if they would like.
The correct answer though is to always monitor.
*** DONE Building up simple monitoring on Healthchecks :healthchecks:cron:curl:
:PROPERTIES:
:EXPORT_HUGO_LASTMOD: 2020-02-11
:EXPORT_DATE: 2020-02-11
:EXPORT_FILE_NAME: building-up-simple-monitoring-on-healthchecks
:CUSTOM_ID: building-up-simple-monitoring-on-healthchecks
:END:
I talked previously in "#simple-cron-monitoring-with-healthchecks" about deploying my own simple monitoring system.
Now that it's up, I'm only using it for my backups. That's a good use, for sure, but I know I can do better.
So I went digging.
#+hugo: more
**** Introduction
I host a list of services, some are public like my blog while others private.
These services are not critical, some can be down for short periods of time.
Some services might even be down for longer periods without causing any loss in functionality.
That being said, I'm a /DevOps engineer/. That means, I need to know.
Yea, it doesn't mean I'll do something about it right away, but I'd like to be in the know.
Which got me thinking...
**** Healthchecks Endpoints
Watching *borg* use its /healthchecks/ hook opened my eyes on another functionality of *Healthchecks*.
It seems that if you ping
#+BEGIN_EXAMPLE
https://healthchecks.example.com/ping/84b2a834-02f5-524f-4c27-a2f24562b219/start
#+END_EXAMPLE
It will start a counter that will measure the time until you ping
#+BEGIN_EXAMPLE
https://healthchecks.example.com/ping/84b2a834-02f5-524f-4c27-a2f24562b219
#+END_EXAMPLE
This way, you can find out how long it is taking you to check on the status of a service. Or maybe, how long a service is taking to backup.
It turns out that /healthchecks/ also offers a different endpoint to ping. You can report a failure straight away by pinging
#+BEGIN_EXAMPLE
https://healthchecks.example.com/ping/84b2a834-02f5-524f-4c27-a2f24562b219/fail
#+END_EXAMPLE
This way, you do not have to wait until the time expires before you get notified of a failure.
With those pieces of knowledge, we can do a lot.
**** A lot ?
Yes, a lot...
Let's put what we have learned so far into action.
#+BEGIN_SRC sh :noeval
#!/bin/bash
WEB_HOST=$1
CHECK_ID=$2
HEALTHCHECKS_HOST="https://healthchecks.example.com/ping"
curl -fsS --retry 3 "${HEALTHCHECKS_HOST}/${CHECK_ID}/start" > /dev/null
OUTPUT=`curl -sS "${WEB_HOST}"`
STATUS=$?
if $STATUS -eq 0 ; then
curl -fsS --retry 3 "${HEALTHCHECKS_HOST}/${CHECK_ID}" > /dev/null
else
curl -fsS --retry 3 "${HEALTHCHECKS_HOST}/${CHECK_ID}/fail" > /dev/null
fi
#+END_SRC
We start by defining a few variables for the website hostname to monitor, the check ID provided by /healthchecks/ and finally the /healthchecks/ base link for the monitors.
Once those are set, we simply use =curl= with a couple of special flags to make sure that it fails properly if something goes wrong.
We start the /healthchecks/ timer, run the website check and either call the passing or the failing /healthchecks/ endpoint depending on the outcomes.
#+BEGIN_EXAMPLE
$ chmod +x https_healthchecks_monitor.sh
$ ./https_healthchecks_monitor.sh https://healthchecks.example.com 84b2a834-02f5-524f-4c27-a2f24562b219
#+END_EXAMPLE
Test it out.
**** Okay, that's nice but now what !
Now, let's hook it up to our cron.
Start with =crontab -e= which should open your favorite text editor.
Then create a cron entry (a new line) like the following:
#+BEGIN_EXAMPLE
*/15 * * * * /path/to/https_healthchecks_monitor.sh https://healthchecks.example.com 84b2a834-02f5-524f-4c27-a2f24562b219
#+END_EXAMPLE
This will run the script every 15 minutes. Make sure that your timeout is 15 minutes for this check, with a grace period of 5 minutes.
That configuration will guarantee that you will get notified 20 minutes after any failure, at the worst.
Be aware, I said any failure.
Getting notified does not guarantee that your website is down.
It can only guarantee that /healthchecks/ wasn't pinged on time.
Getting notified covers a bunch of cases. Some of them are:
- The server running the cron is down
- The cron services is not running
- The server running the cron lost internet access
- Your certificate expired
- Your website is down
You can create checks to cover most of these if you care to make it a full monitoring system.
If you want to go that far, maybe you should invest in a monitoring system with more features.
**** Conclusion
Don't judge something by its simplicity. Somethings, out of simple components tied together you can make something interesting and useful.
With a little of scripting, couple of commands and the power of cron we were able to make /healthchecks/ monitor our websites.
*** DONE Upgrade your monitoring setup with Prometheus :prometheus:metrics:container:
:PROPERTIES:
:EXPORT_HUGO_LASTMOD: 2021-09-17
:EXPORT_DATE: 2021-09-17
:EXPORT_FILE_NAME: upgrade-your-monitoring-setup-with-prometheus
:CUSTOM_ID: upgrade-your-monitoring-setup-with-prometheus
:END:
After running simple monitoring for quite a while, I decided to upgrade my
setup. It is about time to get some real metric gathering to see what's going
on. It's also time to get some proper monitoring setup.
There are a lot of options in this field and I should, probably, write a blog
post on my views on the topic. For this experiment, on the other hand, the
solution is already pre-chosen. We'll be running Prometheus.
#+hugo: more
**** Prometheus
To answer the question, /what is Prometheus?/, we'll rip a page out of the
Prometheus https://prometheus.io/docs/introduction/overview/][docs.
#+begin_quote
Prometheus is an open-source systems monitoring and alerting toolkit originally
built at SoundCloud. Since its inception in 2012, many companies and
organizations have adopted Prometheus, and the project has a very active
developer and user community. It is now a standalone open source project and
maintained independently of any company. To emphasize this, and to clarify the
project's governance structure, Prometheus joined the Cloud Native Computing
Foundation in 2016 as the second hosted project, after Kubernetes.
Prometheus collects and stores its metrics as time series data, i.e. metrics
information is stored with the timestamp at which it was recorded, alongside
optional key-value pairs called labels.
#+end_quote
let's decypher all this jargon down to plain English. In simple terms,
Prometheus is a system that scrape metrics, from your services and applications,
and stores those metrics, in a time series database, ready to serve back again
when queried.
Prometheus also offers a way to create rules on those metrics to alert you when
something goes wrong. Combined with https://prometheus.io/docs/alerting/latest/alertmanager/][/Alertmanager/, you got yourself a full
monitoring system.
**** Configuration
Now that we briefly touched on a /few/ features of *Prometheus* and before we
can deploy, we need to write our configuration.
This is an example of a bare configuration.
#+NAME: prometheus-scraping-config
#+begin_src yaml
scrape_configs:
- job_name: prometheus
scrape_interval: 30s
static_configs:
- targets:
- prometheus:9090
#+end_src
This will make Prometheus scrape itself every 30 seconds for metrics. At least
you get /some/ metrics to query later. If you want the full experience, I would
suggest you enable /Prometheus metrics/ for your services. Consult the docs of
the project to see if and how it can expose metrics for /Prometheus/ to scrape,
then add the scrape endpoint to your configuration as shown above.
Here's a an example of a couple more, /well known/, projects; https://prometheus.io/docs/alerting/latest/alertmanager/][/Alertmanager/ and
https://github.com/prometheus/node_exporter][/node exporter/.
#+NAME: prometheus-example-scraping-config
#+begin_src yaml
- job_name: alertmanager
scrape_interval: 30s
static_configs:
- targets:
- alertmanager:9093
- job_name: node-exporter
scrape_interval: 30s
static_configs:
- targets:
- node-exporter:9100
#+end_src
A wider https://prometheus.io/docs/instrumenting/exporters/][list of exporters can be found on the Prometheus docs.
**** Deployment
Now that we got ourselves a cofniguration, let's deploy *Prometheus*.
Luckily for us, Prometheus comes containerized and ready to deploy. We'll be
using =docker-compose= in this example to make it easier to translate later to
other types of deployments.
#+BEGIN_EXPORT html
Note
I'm still running on 2.x API version. I know I need to upgrade to a newer
version but that's a bit of networking work. It's an ongoing work.
The docker-compose file should look like the following.
---
version: '2.3'

services:
  prometheus:
    image: quay.io/prometheus/prometheus:v2.27.0
    container_name: prometheus
    mem_limit: 400m
    mem_reservation: 300m
    restart: unless-stopped
    command:
      - --config.file=/etc/prometheus/prometheus.yml
      - --web.external-url=http://prometheus.localhost/
    volumes:
      - "./prometheus/:/etc/prometheus/:ro"
    ports:
      - "80:9090"
A few things to note, especially for the new container crowd. The container
image version is explicitly specified, do not use latest in production.
To make sure I don't overload my host, I set memory limits. I don't mind if it goes down, this is a PoC (Proof of Concept) for the time being. In your case, you might want to choose higher limits to give it more room to breath. When the memory limit is reached, the container will be killed with Out Of Memory error.
In the command section, I specify the external url for Prometheus to redirect me correctly. This is what Prometheus thinks its own hostname is. I also specify the configuration file, previously written, which I mount as read-only in the volumes section.
Finally, we need to port-forward 9090 to our hosts' 80 if possible to access
Prometheus. Otherwise, figure out a way to route it properly. This is a local
installation, which is suggested by the Prometheus hostname.
If you made it so far, you should be able to run this with no issues.
docker-compose up -dPrometheus Rules
Prometheus supports two types of rules; recording and alerting. Let's expand a little bit on those two concepts.
Recording Rules
First, let's start off with recording rules. I don't think I can explain it better than the Prometheus documentation which says.
Recording rules allow you to precompute frequently needed or computationally expensive expressions and save their result as a new set of time series. Querying the precomputed result will then often be much faster than executing the original expression every time it is needed. This is especially useful for dashboards, which need to query the same expression repeatedly every time they refresh.
Sounds pretty simple right ? Well it is. Unfortunately, I haven't needed to create recording rules yet for my setup so I'll forgo this step.
Alerting Rules
As the name suggests, alerting rules allow you to define conditional expressions based on metrics which will trigger notifications to alert you.
This is a very simple example of an alert rule that monitors all the endpoints scraped by Prometheus to see if any of them is down. If this expression return a result, an alert will fire from Prometheus.
groups:
- name: Instance down
  rules:
  - alert: InstanceDown
    expr: up == 0
    for: 5m
    labels:
      severity: page
    annotations:
      summary: "Instance {{ $labels.instance }} down"
      description: "{{ $labels.instance }} of job {{ $labels.job }} has been down for more than 5 minutes."
To be able to add this alert to Prometheus, we need to save it in a
rules.yml file and then include it in the Prometheus configuration as follows.
rule_files:
- "rules.yml"
Making the configuration intiretly as follows.
<<prometheus-rule-files-config>>

<<prometheus-scraping-config>>

<<prometheus-example-scraping-config>>
At this point, make sure everything is mounted into the container properly and rerun your Prometheus.
Prometheus UI
Congratulations if you've made it so far. If you visit http://localhost/ at stage you should get to Prometheus where you can query your metrics.
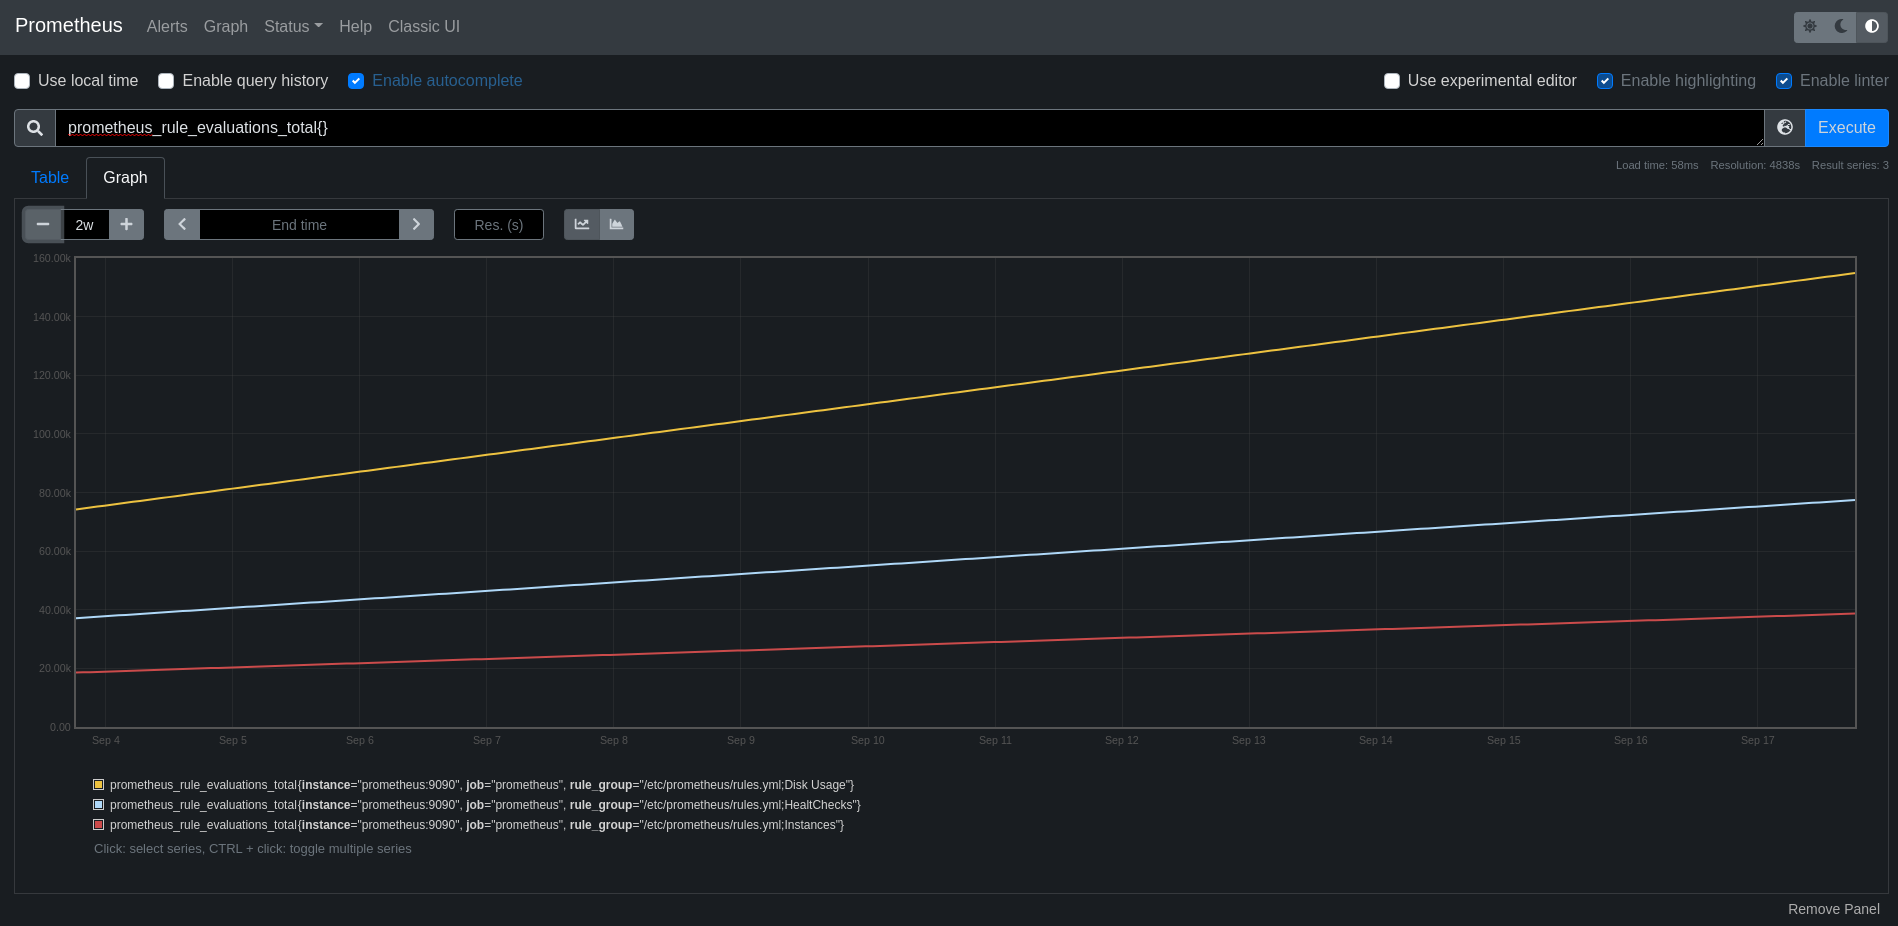
You can get all sorts of information under the status drop-down menu.

Conclusion
As you can see, deploying Prometheus is not too hard. If you're running Kubernetes, make sure you use the operator. It will make your life a lot easier in all sorts of things.
Take your time to familiarise yourself with Prometheus and consult the documentation as much as possible. It is well written and in most cases your best friend. Figure out different ways to create rules for recording and alerting. Most people at this stage deploy Grafana to start visualizing their metrics. Well… Not in this blog post we ain't !
I hope you enjoy playing around with Prometheus and until the next post.
Nikola @nikola
DONE Welcome back to the old world blog org_mode emacs rst
I have recently blogged about moving to emacs and the reasons behind it.
Since then, I have used Orgmode a lot more. And I have begun to like it even more. I had a plan to move the blog to Hugo. After giving it a try, I had inconsistent results. I must've been doing something wrong. I've spend a lot more time than I anticipated on it. At some point, it becomes an endeavor with diminishing returns. So I ditched that idea.
But why did I want to move to Hugo in the first place ?
Why Hugo you may ask
Well, the answer to that question is very simple; Orgmode.
The long answer is that the default Nikola markup language and the most worked on is reStructuredText. It can support other formats. Orgmode also seems widely supported and can be easily manipulated. So I want to move to Orgmode instead of rst.
But what are the odds ?
Damn… It has plugins and you can find an orgmode page where you find
$ nikola plugin -i orgmode
Where the heck did that come from ? Okay that was easy.
Turns out Nikola supports Orgmode.
Nikola Orgmode plugin installation
The page suggests running.
$ nikola plugin -i orgmode
Followed by
# NOTE: Needs additional configuration in init.el file.

# Add the orgmode compiler to your COMPILERS dict.
COMPILERS["orgmode"] = ['.org']

# Add org files to your POSTS, PAGES
POSTS = POSTS + (("posts/*.org", "posts", "post.tmpl"),)
PAGES = PAGES + (("pages/*.org", "pages", "page.tmpl"),)
Okay, that's not too bad. Next step.
Alright, let's run our first org post
The installation was easy, running it should be just as easy.
$ nikola auto
[2020-08-31 23:16:17] INFO: auto: Rebuilding the site...
Scanning posts..........done!
.  render_taxonomies:output/archive.html
.  render_taxonomies:output/categories/index.html

...

.  copy_assets:output/assets/css/index.css
.  copy_assets:output/assets/css/index.css.map
.  copy_assets:output/assets/js/index.js.map
.  copy_assets:output/assets/js/index.js
.  copy_assets:output/assets/css/rst_base.css
.  copy_assets:output/assets/css/ipython.min.css
.  copy_assets:output/assets/css/html4css1.css
.  copy_assets:output/assets/css/nikola_rst.css
.  copy_assets:output/assets/css/baguetteBox.min.css
.  copy_assets:output/assets/css/nikola_ipython.css
.  copy_assets:output/assets/css/rst.css
.  copy_assets:output/assets/css/theme.css
.  copy_assets:output/assets/js/justified-layout.min.js
.  copy_assets:output/assets/js/html5.js
.  copy_assets:output/assets/js/gallery.min.js
.  copy_assets:output/assets/js/fancydates.js
.  copy_assets:output/assets/js/baguetteBox.min.js
.  copy_assets:output/assets/js/gallery.js
.  copy_assets:output/assets/js/html5shiv-printshiv.min.js
.  copy_assets:output/assets/js/luxon.min.js
.  copy_assets:output/assets/js/fancydates.min.js
.  copy_assets:output/assets/xml/rss.xsl
.  copy_assets:output/assets/xml/atom.xsl
.  copy_assets:output/assets/css/code.css
.  render_posts:cache/posts/text-editors/emacs-and-org-mode.html
Loading /etc/emacs/site-start.d/00debian.el (source)...
Loading /etc/emacs/site-start.d/50dictionaries-common.el (source)...
Loading debian-ispell...
Loading /var/cache/dictionaries-common/emacsen-ispell-default.el (source)...
Loading /var/cache/dictionaries-common/emacsen-ispell-dicts.el (source)...
Created img-url link.
Created file link.
Please install htmlize from https://github.com/hniksic/emacs-htmlize
TaskError - taskid:render_posts:cache/posts/text-editors/emacs-and-org-mode.html
PythonAction Error
Traceback (most recent call last):
  File "/home/user/blog.lazkani.io/plugins/orgmode/orgmode.py", line 75, in compile
    subprocess.check_call(command)
  File "/home/user/anaconda3/envs/nikola/lib/python3.8/subprocess.py", line 364, in check_call
    raise CalledProcessError(retcode, cmd)
subprocess.CalledProcessError: Command '['emacs', '--batch', '-l', '/home/user/blog.lazkani.io/plugins/orgmode/init.el', '--eval', '(nikola-html-export "/home/user/blog.lazkani.io/posts/text-editors/emacs-and-org-mode.org" "/home/user/blog.lazkani.io/cache/posts/text-editors/emacs-and-org-mode.html")']' returned non-zero exit status 255.

During handling of the above exception, another exception occurred:

Traceback (most recent call last):
  File "/home/user/anaconda3/envs/nikola/lib/python3.8/site-packages/doit/action.py", line 437, in execute
    returned_value = self.py_callable(*self.args, **kwargs)
  File "/home/user/anaconda3/envs/nikola/lib/python3.8/site-packages/nikola/post.py", line 711, in compile
    self.compile_html(
  File "/home/user/blog.lazkani.io/plugins/orgmode/orgmode.py", line 94, in compile
    raise Exception('''Cannot compile {0} -- bad org-mode configuration (return code {1})
Exception: Cannot compile posts/text-editors/emacs-and-org-mode.org -- bad org-mode configuration (return code 255)
The command is emacs --batch -l /home/user/blog.lazkani.io/plugins/orgmode/init.el --eval '(nikola-html-export "/home/user/blog.lazkani.io/posts/text-editors/emacs-and-org-mode.org" "/home/user/blog.lazkani.io/cache/posts/text-editors/emacs-and-org-mode.html")'

########################################
render_posts:cache/posts/text-editors/emacs-and-org-mode.html <stdout>:

[2020-08-31 23:16:29] INFO: auto: Serving on http://127.0.0.1:8000/ ...
[2020-08-31 23:16:36] INFO: auto: Server is shutting down.
I knew there was a catch !
You might be looking for the error message and it might take you a while. It took me a bit to find out what was wrong. The error is actually the following.
Please install htmlize from https://github.com/hniksic/emacs-htmlize
It turns out that the plugin is a python script that calls emacs with a configuration init.el. I know I have htmlize installed on my doom system but Nikola does not see it.
After looking around the internet, I found the init.el file I'm looking for. It's in plugins/orgmode/init.el and it has the following few lines at the top.
(require 'package)
(setq package-load-list '((htmlize t)))
(package-initialize)
Okay, that's what's trying to load htmlize. Let's try to add it to the load-path as follows.
(require 'package)
(add-to-list 'load-path "~/.emacs.d/.local/straight/build/htmlize")
(setq package-load-list '((htmlize t)))
(package-initialize)
Note
In my case, the path to htmlize is ~/.emacs.d/.local/straight/build/htmlize.
If you don't have it installed, simply git clone the repository in a directory and load-path that path.
Now, let's try Nikola.
$ nikola auto
[2020-08-31 23:30:32] INFO: auto: Rebuilding the site...
Scanning posts..........done!
[2020-08-31 23:30:36] INFO: auto: Serving on http://127.0.0.1:8000/ ...
Woohoo ! It works. Now let's move to the next steps. Writing our first blog post.
First Org post
Let's create this blog post.
Warning
It is very important to use the nikola command line interface to create the post. I spent too much time trying to figure out the header settings.
$ nikola new_post -1 -f orgmode -t orgmode posts/misc/welcome-back-to-the-old-world.org
Now edit the org file and save it. Nikola should pick it up and render it.
Yes, I have made more changes
Theme
I have moved the blog to the willy-theme which offers light and dark modes and good code highlighting.
Blog post format
You might have also noticed that there were big changes to the repository. All the blog posts have been converted to Orgmode now, both pages and posts.
I used pandoc to do the initial conversion from rst to Orgmode as follows.
$ pandoc --from rst --to org /path/to/file.rst > /path/to/file.org
I know, I know. It does a pretty good initial job but you will need to touch up the posts. Fortunately, I did not have a lot of blog posts yet. Unfortunately, I had enough for the task to take a few days. For me, it was worth it.
Conclusion
This was a long overdue project, I am happy to finally put it behind me and move foward with something simple that works with my current flow.
DONE Modifying a Nikola theme theme blog
After publishing my blog in new form yesterday night, I have received some suggestions for changes to the theme.
First off, I noticed that the footer is not showing after the blog was deployed. That reminded me that I have made changes to the original theme on disk. The pipeline, though, install the theme fresh before deploying the website.
I needed to fix that. Here's how I did it.
Create a new theme
This might be counter intuitive but themes in Nikola can actually have parents. So what we need to do is clone the theme we want to modify while keeping it as parent to our theme. I'll show you.
First, create your new theme.
$ nikola theme --new custom-willy-theme --parent willy-theme --engine=jinja
Note
I had to use --engine=jinja because willy-theme uses jinja templating. If you are using the mako engine, you don't need to add thihs as the default is mako.
Warning
You will probably need both themes in your themes/ directory. The willy-theme needs to be installed before creating your custom theme from it.
This should create themes/custom-willy-theme/. If we look inside, we'll see one file that describes this theme with its parent.
Go to your conf.py and change the theme to custom-willy-theme.
Let's talk hierarchy
Now that we have our own custom theme out of the willy-theme, if we rebuild the blog we can see that nothing changes. Of course, we have not made any modifications. But did you ever ask yourself the question, why did the site not change ?
If your theme points to a parent, whatever Nikola expects will have to be your theme first with a failover to the parent theme. Ok, if you've followed so far, you will need to know what Nikola is expecting right ?
You can dig into the documentation here to find out what you can do, but I wanted to change a few things to the theme. I wanted to add a footer, for example.
It turns out for willy-theme that is located in the templates/base.tmpl. All I did was the following
$ mkdir themes/custom-willy-theme/templates
$ cp themes/willy-theme/templates/base.tmpl themes/custom-willy-theme/templates/
I made my modification to the base.tmpl and rendered the blog. It was that simple. My changes were made.
Conclusion
You can always clone the theme repository and make your modifications to it. But maintenance becomes an issue. This seems to be a cleaner way for me to make modifications on the original theme I'm using. This is how you can too.
Nix @nix
DONE NixOS on encrypted ZFS @nixos zfs encryption
I wouldn't call myself a distro hopper. The decision of distribution is solely based on requirements. I have requirements and I want the distribution to fulfill them as much as possible. After 15 years, I know what I want and I go and find it.
In this case, an unexpected project caught my eye. The idea is so radically different that I wasn't actually searching for it this time. It is one of those times where it found me first.
After looking into Nix and NixOS, I decided it is going to be my distribution of choice on the desktop. I will use that as my test bed before migrating all the serious work there. That's how I got my first taste of NixOS outside of the deterministic virtualization layer and into the wild.
Requirements
Before installing any new system, I draftdown a list of requirements I would need this system to run. These are things that are very hard to change on the fly in the future without some serious work. Also, things that simply need to be there in this day and age.
Filesystem
I'm a big fan of zfs. I've been running it on Linux, since the openzfs
project successfully ported it, with no issues. It's a solid choice for a
filesystem and I don't see a reason not to choose it.
Is it really a requirement ?
Well, yes. By now, openzfs should be accessible to all distributions but my
choice of distribution is not usually for the beginner user. I need to know
it's supported and documented. I can figure out the rest from there.
Encryption
This is the first requirement, I always want encryption. The reason why I put it
second in the list is that I needed to talk about zfs first.
The zfs filesystem offers encryption. Unfortunately, my research have shown
that zfs might not encrypt some metadata. This might not be a big deal but the
choice of using Luks is there as well.
With Luks, we can encrypt the whole drive. So let's do that; Luks with zfs on top.
NixOS
NixOS utilizes Nix to build you an OS from a configuration file. This
configuration file is written in the nix language. It is very analogous to
written an Ansible playbook but it builds an OS instead.
The idea sounded appealing to me. A good friend of mine, setkeh, gave me a quick and
dirty overview, at first. That pushed me into doing more research of my own
where I found out that I can spawn off a nix-shell with whatever dependencies
I want without having them installed on my system. What a great concept for
development or even running applications you don't really want to run. Java
stuff for example.
Anyway, for all of these different reasons I have chosen NixOS to be the OS of choice to go on the desktop.
Installation
After testing NixOS in a VM a few times, I got setkeh on a conference
session and we dug into this.
Filesystem partitioning
For the filesystem, we're going to create two partitions. We need one, vfat,
for the boot and another, zfs, for the rest of the filesystem.
Note
The assumption is that we're installing NixOS on an EFI enabled system.
We can start by creating the first partition of 1GB.
sgdisk -n3:1M:+1024M -t3:EF00 /dev/disk/by-id/VENDOR-IDFollowed by the rest of the filesystem.
sgdisk -n1:0:0 -t1:BF01 /dev/disk/by-id/VENDOR-IDNote
It is usually easier to do the partitioning using GParted. Make sure that the
partitions are unformatted, if you do so.
Warning
Do NOT forget to enable the boot flag on the first partition or your system will not boot.
Filesystem formatting
Now that we got our partitions creates, let's go ahead and format them properly.
Starting with the boot partition first.
mkfs.vfat /dev/disk/by-id/VENDOR-ID-part1Warning
At this sage, you're formatting a partition. Make sure you're pointing to the partition and not your whole disk as in the previous section.
Then our zfs partition, but we need to encrypt it first. So, we create the
Luks partition.
cryptsetup luksFormat /dev/disk/by-id/VENDOR-ID-part2
At this stage, stage we are done with the filesystem formatting and we need to
create the zfs pool. To do so, we need to mount the encrypted root
filesystem; Luks.
cryptsetup open --type luks /dev/disk/by-id/VENDOR-ID-part2 crypt
This mounts the filesystem in /dev/mapper/crypt. We'll use that to create the pool.
zpool create -O mountpoint=none rpool /dev/mapper/crypt
zfs create -o mountpoint=legacy rpool/root
zfs create -o mountpoint=legacy rpool/root/nixos
zfs create -o mountpoint=legacy rpool/home
Filesystem mounting
After creating the filesystem, let's mount everything.
# Mounting filesystem
mount -t zfs rpool/root/nixos /mnt
mkdir /mnt/home
mkdir /mnt/boot
# Mounting home directory
mount -t zfs rpool/home /mnt/home
# Mounting boot partition
mount /dev/disk/by-id/VENDOR-ID-part1 /mnt/boot
Generating NixOS configuration
At this stage, we need a nix configuration to build our system from. I didn't
have any configuration to start from so I generated one.
nixos-generate-config --root /mntNixOS configuration
Due to the weird configuration we've had, we need to make a few adjustements to the suggested configuration layed out in the docs.
The required configuration bits to be added to
/mnt/etc/nixos/configuration.nix are:
boot.supportedFilesystems = [ "zfs" ];
# Make sure you set the networking.hostId option, which ZFS requires:
networking.hostId = "<random 8-digit hex string>";
# See https://nixos.org/nixos/manual/options.html#opt-networking.hostId for more.

# Use the GRUB 2 boot loader.
boot.loader.grub = {
  enable = true;
  version =2;
  device = "nodev";
  efiSupport = true;
  enableCryptodisk = true;
};

boot.initrd.luks.devices = {
 root = {
   device = "/dev/disk/by-uuid/VENDOR-UUID-part2"; ## Use blkid to find this UUID
   # Required even if we're not using LVM
   preLVM = true;
 };
};
NixOS installation
If we're done with all of the configuration as described above, we should be able to build a bootable system. Let's try that out by installing NixOS.
nixos-installConclusion
It took a bit of trial and error, and a loooooooot of mounting over and over again. At the end, though, it wasn't as bad as I thought it would be. I'm still trying to get myself familiarised with NixOS and the new way of doing things. All in all, I would recommend trying NixOS, or the very least Nix.
Revision Control @revision_control
DONE Git! First Steps… git
The topic of git came up recently a lot at work. Questions were asked about why I like to do what I do and the reasoning beind.
Today, I joined #dgplug on freenode and it turns out it was class time and the topic is git and writing a post on it.
Which got me thinking… Why not do that ?
Requirements
I'd like to start my post with a requirement, git. It has to be installed on your machine, obviously, for you to be able to follow along.
A Few Concepts
I'm going to try to explain a few concepts in a very simple way. That means I am sacrificing accuracy for ease of understanding.
What is revision control?
Wikipedia describes it as:
"A component of software configuration management, version control, also known as revision control or source control, is the management of changes to documents, computer programs, large web sites, and other collections of information."
In simple terms, it keeps track of what you did and when as long as you log that on every change that deserve to be saved. This is a very good way to keep backups of previous changes, also a way to have a history documenting who changed what and for what reason (NO! Not to blame, to understand why and how to fix it).
What is a git commit?
You can read all about what a commit is on the manual page of git-commit. But the simple way to understand this is, it takes a snapshot of your work and names it a SHA number (very long string of letters and numbers). A SHA is a unique name that is derived from information from the current commit and every commit that came before since the beginning of the tree. In other words, there is an extremely low chance that 2 commits would ever have the same SHA. Let's not also forget the security implication from this. If you have a clone of a repository and someone changed a commit somewhere in the tree history, every commit including the one changed and newer will have to change names. At that point, your fork will have a mismatch and you can know that the history was changed.
What is the git add thingy for?
Well the git-add manual page is very descriptive about the subject but, once again, I'll try to explain it in metaphors.
Think of it this way, git-commit saves the changes, but what changes ? That's exactly the question to answer. What changes ?
What if I want to commit some changes but not others ? What if I want to commit all the code in one commit and all the comments in another ?
That's where the "staging area" comes in play. You use git-add to stage files to be committed. And whenever you run the git-commit command, it will commit whatever is staged to be committed, right ?
Practice
Now that we've already explained a few concepts, let's see how this all fits together.
Step 1: Basic git configuration
The Getting Started - First-Time Git Setup has more detailed setup but I took out what's quick and easy for now.
First setup your name and email.
 $ git config --global user.name "John Doe"
 $ git config --global user.email johndoe@example.com
You're done !
Step 2: Creating a repository
This is easy. If you want to be able to commit, you need to create a project to work on. A "project" can be translated to a repository and everything in that directory will be tracked. So let's create a repository
 $ # Navigate to where you'd like to create the repository
 $ cd ~/Documents/Projects/
 $ # Create repository directory
 $ mkdir example
 $ # Navigate into the newly created directory
 $ cd example
 $ # Create the repository
 $ git init
Yeah, it was only one command git init. Told you it was easy, didn't I?
Step 3: Make a change
Let's create a file called README.md in the current directory (~/Documents/Projects/example) and put the following in it.
# Example

This is an example repository.
And save it of course.
Step 4: Staging changes
If you go back to the command line and check the following command, you'll see a similar result.
 $ git status
 On branch master

 No commits yet

 Untracked files:
   (use "git add <file>..." to include in what will be committed)

    	README.md

 nothing added to commit but untracked files present (use "git add" to track)
and README.md is in red (if you have colors enabled). This means that there is file that is not tracked in your repository. We would like to track that one, let's stage it.
 $ git add README.md
 $ git status
 On branch master

 No commits yet

 Changes to be committed:
   (use "git rm --cached <file>..." to unstage)

    new file:   README.md
And README.md would now become green (if you have colors enabled). This means that if you commit now, this new file will be added and tracked in the future for changes. Technically though, it is being tracked for changes right now.
Let's prove it.
 $ echo "This repository is trying to give you a hands on experience with git to complement the post." >> README.md
 $ git status
 On branch master

 No commits yet

 Changes to be committed:
   (use "git rm --cached <file>..." to unstage)

    new file:   README.md

 Changes not staged for commit:
   (use "git add <file>..." to update what will be committed)
   (use "git checkout -- <file>..." to discard changes in working directory)

    modified:   README.md
As you can see, git figured out that the file has been changed. Now let's add these changes too and move forward.
 $ git add README.md
 $ git status
 On branch master

 No commits yet

 Changes to be committed:
   (use "git rm --cached <file>..." to unstage)

    new file:   README.md
Step 5: Committing
This will be as easy as the rest. Let's commit these changes with a good commit message to describe the changes.
 $ git commit -m "Second commit"
 [master (root-commit) 0bd01aa] Second commit
  1 file changed, 4 insertions(+)
  create mode 100644 README.md
Very descriptive commit indeed !
 $ git status
 On branch master
 nothing to commit, working tree clean
Of course ! There is nothing to commit !
 $ git log
 commit 0bd01aa6826675f339c3173d7665ebb44c3894a7 (HEAD -> master)
 Author: John Doe <johndoe@example.com>
 Date:   Mon Jul 22 20:57:40 2019 +0200

     Second commit
You can definitely see who committed it, when and what the message was. You also have access to the changes made in this commit.
Conclusion
I'm going to end this post here, and will continue to build up the knowledge in new posts to come. For now, I think it's a good idea to simply work with commits. Next concepts to cover would be branching and merging.
DONE Git! Branching and Merging git branch merge
In the previous post about git, we had a look at what git is and got our feet wet with a bit of it. In this post, I will be moving forward with the topic, I will be talking about branches, how to work with them and finally what merging is and how it works.
Requirements
The same requirement we had from the last post, obviously git.
Branching and Merging
What is a branch?
git documentation describes it as:
"A branch in Git is simply a lightweight movable pointer to one of the[se] commits."
Usually, people coming from svn think of branches differently. In git, a branch is simply a pointer to a commit.
So let's verify that claim to see if it's true.
Remember our example repository from the last post ? We'll be using it here.
First let's create a new branch.
 $ git checkout -b mybranch
 Switched to a new branch 'mybranch'
That was simple, wasn't it ? Alright, let's test our hypothesis.
 $ git log
 commit 643a353370d74c26d7cbf5c80a0d73988a75e09e (HEAD -> mybranch, master)
 Author: John Doe <johndoe@example.com>
 Date:   Thu Aug 1 19:50:45 2019 +0200

     Second commit
The commit is, of course, different because this is a different computer with a different repository from scratch. Anyway, it seems from the log message that both mybranch and master are pointing to same commit SHA. Technically they are pointing to HEAD.
Now let's continue and add a new commit.
 $ echo "" >> README.md
 $ git add README.md
 $ git commit -m "Adding an empty line"
 [mybranch b30f4e0] Adding an empty line
  1 file changed, 1 insertion(+)
After this last commit, let's check the log
 $ git log
 commit b30f4e0fa8f3b5c9f041c9ad1be982b2fed80851 (HEAD -> mybranch)
 Author: John Doe <johndoe@example.com>
 Date:   Thu Aug 1 20:28:05 2019 +0200

      Adding an empty line

 commit 643a353370d74c26d7cbf5c80a0d73988a75e09e (master)
 Author: John Doe <johndoe@example.com>
 Date:   Thu Aug 1 19:50:45 2019 +0200

      Second commit
From reading the output of log, we can see that the master branch points to a different commit than mybranch.
To visualize this, let's look at it in a different way.
 $ git log --graph --oneline --all
 * b30f4e0 (HEAD -> mybranch) Adding an empty line
 * 643a353 (master) Second commit
What the above suggests is that our two branches have different contents at this stage. In other words, if I switch back to the master branch what do you think we will find in README.md ?
 $ git checkout master
 Switched to branch 'master'
 $ cat README.md
 # Example

 This is an example repository.
 This repository is trying to give you a hands on experience with git to complement the post.
 $
And if we switch back to mybranch.
 $ git checkout mybranch
 Switched to branch 'mybranch'
 $ cat README.md
 # Example

 This is an example repository.
 This repository is trying to give you a hands on experience with git to complement the post.

 $
Let's add another commit to make easier to see the changes than an empty line.
 $ echo "Let's add a line to mybranch." >> README.md
 $ git add README.md
 $ git commit -m "Adding more commits to mybranch"
 [mybranch f25dd5d] Adding more commits to mybranch
  1 file changed, 1 insertion(+)
Now let's check the tree again.
 $ git log --graph --oneline --all
 * f25dd5d (HEAD -> mybranch) Adding more commits to mybranch
 * b30f4e0 Adding an empty line
 * 643a353 (master) Second commit
Let's also check the difference between our master branch and mybranch.
 $ git diff master mybranch
 diff --git a/README.md b/README.md
 index b4734ad..f07e71e 100644
 --- a/README.md
 +++ b/README.md
 @@ -2,3 +2,5 @@

  This is an example repository.
  This repository is trying to give you a hands on experience with git to complement the post.
 +
 +Let's add a line to mybranch.
The + suggests an addition and - suggests a deletion of a line. As we can see from the + shown before the two lines added to the README.md file, mybranch has these additions.
You can read more about git branches in the git documentation page.
What is merging ?
That's all fine so far, but how do I get these changes from mybranch to the master branch ?
The answer to that is also as easy as all the steps taken so far. git merges from a branch you specify to the branch you are currently on.
 $ # Checking which branch we are on
 $ git branch
   master
 * mybranch
 $ # We are on mybranch and we need to put these changes into master
 $ # First we need to move to our master branch
 $ git checkout master
 Switched to branch 'master'
 $ # Now we can merge from mybranch
 $ git merge mybranch
 Updating 643a353..f25dd5d
 Fast-forward
  README.md | 2 ++
  1 file changed, 2 insertions(+)
As we can see. The changes in mybranch have been merged into the master branch.
 $ git log
 commit f25dd5da3e6f91d117177782a5811d5086f66799 (HEAD -> master, mybranch)
 Author: John Doe <johndoe@example.com>
 Date:   Thu Aug 1 20:43:57 2019 +0200

     Adding more commits to mybranch

 commit b30f4e0fa8f3b5c9f041c9ad1be982b2fed80851
 Author: John Doe <johndoe@example.com>
 Date:   Thu Aug 1 20:28:05 2019 +0200

     Adding an empty line

 commit 643a353370d74c26d7cbf5c80a0d73988a75e09e
 Author: John Doe <johndoe@example.com>
 Date:   Thu Aug 1 19:50:45 2019 +0200

     Second commit
Merging Strategies
I'll explain to you how I like to work and my personal merging strategy. I will keep out some details as they use concepts that are more advanced than what has been discussed so far.
master branch
To me, the master branch stays always up to date with the remote master branch. In other words, I do not make commits against the master branch in the project I'm working on.
branch
If I want to work on the project, I start by updating the master branch and then branching it as we've seen before. The name of the branch is always indicative on what it holds, or what kind of work I am doing on it.
As long as I am working on my dev branch, I keep updating the master branch and then porting the changes into my dev branch. This way, at the end the code is compatible and I am testing with the latest version of the code. This is very helpful and makes merging later a breeze.
merging
After my work is done, I push my branch to the remote server and ask for the maintainer of the project to merge my changes into the master branch after reviewing it, of course. To explain this in a very simple manner, all that mumbo jumpo talk previously simply means someone else did the merge into master.
Conclusion
In this post, I talked about what are branches. We went ahead and worked a little bit with branches and then mentioned merging. At the end of the post I talked a bit about my merging strategy.
In the next post, I will be talking about remotes.
DONE Git! Remotes… rebase remotes git
In the previous post, we talked about branching and merging. We will say a few last words on branches in this post and dive into remotes.
What are remotes ? What are they for ? How are they used ?
Coming right up.
Requirements
Branches
I have a few more things I need to say about branches…
If you came to the same conclusion that branches in git are cheap, you are correct. This is very important because this encourages you to create more branches. A lot of short living branches is a great way to work. Small features added here and there. Small projects to test new features, etc…
Second conclusion you can come up with from the previous post is that the master branch is not a special branch. People use it as a special branch, or the branch of truth by convention only.
I should also note that some services like Gitlab offer master branch protection on their own which would not allow master history overwriting.
The best next topic that comes after branches is a topic extremely similar to it, remotes.
Remotes
The description of git-remote from the manual page is simply
Manage the set of repositories ("remotes") whose branches you track.
That's exactly what it is. A way to manage remote repositories. Now we will be talking about managing them in a bit but let's talk about how to use them. I found the best way to think to work with them is that you can think of them as branches. That's exactly why I thought this would be best fit after that blog post.
Listing
Let's list them on our project and see what's what.
$ git remote -v
Okay! Nothing…
Alright, let's change that.
We don't have a remote repository we can manage. We need to create one.
Adding a remote
So I went to Gitlab and I created a new repository. After creating the repository, you will get a box with commands that look similar to the following.
$ cd existing_repo
$ git remote rename origin old-origin
$ git remote add origin git@gitlab.com:elazkani/git-project.git
$ git push -u origin --all
$ git push -u origin --tags
The first command is useless to us. The second is renaming a remote we do not have. Now the third command is interesting. This one is adding a remote called origin. We need that. The last two commands are there to push everything to the remote repository.
Let's copy that command and put it in our command line.
$ git remote add origin git@gitlab.com:elazkani/git-project.git
$ git remote -v
origin  git@gitlab.com:elazkani/git-project.git (fetch)
origin  git@gitlab.com:elazkani/git-project.git (push)
If you look at that output carefully, you will notice that there is a fetch link and a push link.
Anyway, let's push.
Push
 $ git push -u origin --all
 Enumerating objects: 3, done.
 Counting objects: 100% (3/3), done.
 Delta compression using up to 4 threads
 Compressing objects: 100% (2/2), done.
 Writing objects: 100% (3/3), 317 bytes | 317.00 KiB/s, done.
 Total 3 (delta 0), reused 0 (delta 0)
 To gitlab.com:elazkani/git-project.git
 * [new branch]      master -> master
 Branch 'master' set up to track remote branch 'master' from 'origin'.
We have pushed all of our changes to the remote now. If you refresh the web page, you should see the repository.
So what happens if someone else made a change and pushed to it, or maybe it was you from another computer.
Pulling from a remote
Most people using git usually do git pull and call it a day.
We will not, we will dissect what that command is doing.
You might not know that you can configure git pull to do a rebase instead of a merge.
That's not important for you at this stage but what's important is the clue it gives us.
There is a merge in it.
What git pull actually does is a git fetch followed by a git merge.
So just like git push, git fetch will download the changes from the remote.
If the fetch is followed by a merge, then where are we fetching to and merging from ?
This is where thinking about remotes as branches comes in.
Think of origin/master as a branch, a local branch, because in some way it is.
So let's fetch.
 $ git fetch origin master
 From gitlab.com:elazkani/git-project
  * branch            master     -> FETCH_HEAD
But we don't see any changes to our code !
Ahaaa ! But it did get the new stuff. Let me show you.
$ git diff master origin/master
diff --git a/README.md b/README.md
index b4734ad..a492bbb 100644
--- a/README.md
+++ b/README.md
@@ -2,3 +2,7 @@

This is an example repository.
This repository is trying to give you a hands on experience with git to complement the post.
+
+# Remote
+
+This is the section on git remotes.
See ! Told you.
Now let's get those changes into our master branch.
You guessed it, we only need to merge from origin/master
$ git merge origin/master
Updating 0bd01aa..4f6bb31
Fast-forward
 README.md | 4 ++++
 1 file changed, 4 insertions(+)
That was easy wasn't it ?
Let's have a little chat, you and me !
You can have multiple remotes. Make a good use of them. Go through all the different methodologies online to work with git and try them out.
Find what works for you. Make use of branches and remotes. Make use of merging.
Conclusion
After talking about remotes in this post, you have some reading to do. I hope I've made your journey much simpler moving forward with this topic.
DONE Git! Rebase and Strategies git rebase strategies
In the previous topic, I talked about git remotes because it felt natural after branching and merging.
Now, the time has come to talk a little bit about rebase and some good
cases to use it for.
Requirements
This has not changed people, it is still git.
Rebase
In git there are 2 ways of integrating your changes from one branch into another.
We already talked about one; git-merge. For more information about git-merge consult the git basic branching and merging manual.
The other is git-rebase.
While git-rebase has a lot of different uses, the basic use of it is described in the git branching rebasing manual as:
"With the
rebasecommand, you can take all the changes that were committed on one branch and replay them on a different branch."
In other words, all the commits you have made into the branch you are on will be set aside. Then, all the changes in the branch you are rebasing from will be applied to your branch. Finally, all your changes, that were set aside previously, will be applied back to your branch.
The beauty about this process is that you can keep your branch updated with upstream, while coding your changes. By the end of the process of adding your feature, your changes are ready to be merged upstream straight away. This is due to the fact that all the conflicts would've been resolved in each rebase.
Note
Branch and branch often! if you merge, merge and merge often! or rebase, and rebase often!
Usage
Rebase is used just like merge in our case.
First, let's create a branch and make a change in that branch.
 $ git checkout -b rebasing-example
 Switched to a new branch 'rebasing-example'
 $ printf "\n# Rebase\n\nThis is a rebase branch.\n" >> README.md
 $ git add README.md
 $ git commit -m "Adding rebase section"
 [rebasing-example 4cd0ffe] Adding rebase section
  1 file changed, 4 insertions(+)
 $
Now let's assume someone (or yourself) made a change to the master branch.
 $ git checkout master
 Switched to branch 'master'
 Your branch is up to date with 'origin/master'.
 $ printf "# Master\n\nThis is a master branch" >> master.md
 $ git add master.md
 $ git commit -m "Adding master file"
 [master 7fbdab9] Adding master file
  1 file changed, 3 insertions(+)
  create mode 100644 master.md
 $
I want to take a look at how the tree looks like before I attempt any changes.
 $ git log --graph --oneline --all
 * 7fbdab9 (HEAD -> master) Adding master file
 | * 4cd0ffe (rebasing-example) Adding rebase section
 |/
 * 4f6bb31 (origin/master) Adding the git remote section
 * 0bd01aa Second commit
After both of our commits, the tree diverged.
We are pointing to the master branch, I know that because HEAD points to master.
That commit is different than the commit that rebase-example branch points to.
These changes were introduced by someone else while I was adding the rebase section in the README.md file and they might be crucial for my application.
In short, I was those changes in the code I am working on right now.
Let's do that.
$ git checkout rebasing-example
Switched to branch 'rebasing-example'
$ git rebase master
First, rewinding head to replay your work on top of it...
Applying: Adding rebase section
And, let's look at the tree of course.
 $ git log --graph --oneline --all
 * 1b2aa4a (HEAD -> rebasing-example) Adding rebase section
 * 7fbdab9 (master) Adding master file
 * 4f6bb31 (origin/master) Adding the git remote section
 * 0bd01aa Second commit
The tree lookr linear now. HEAD is pointing to our branch.
That commit points to the 7fbdab9 commit which the master branch also points to.
So rebase set aside 1b2aa4a to apply 7fbdab9 and then re-applied it back. Pretty neat huh ?!
My Strategy
I'm going to be honest with you. I do not know the different kinds of merge strategies. I've glazed at names of a few but I've never looked at them closely enough to see which one is what.
What I use, I've used for a while. I learned it from somewhere and changed a few things in it to make it work for me.
First of all, I always fork a repository. I tend to stay away from creating a branch on the upstream repository unless it's my own personal project. On my fork, I freely roam. I am the king of my own fork and I create as many branches as I please.
I start with an assumption. The assumption is that my master branch is, for all intents and purposes, upstream. This means I keep it up to date with upstream's main branch.
When I make a branch, I make a branch from master, this way I know it's up to date with upstream. I do my work on my branch. Every few hours, I update my master branch. After I update my master branch, I rebase the master branch into my branch and voilà I'm up to date.
By the time my changes are ready to be merged back into upstream for any reason, they are ready to go.
That MR is gonna be ready to be merged in a jiffy.
Conclusion
From what I've read, I use one of those strategies described on some website. I don't know which one. But to me, it doesn't matter because it works for me. And if I need to adapt that for one reason or another, I can.
DONE Git binary clean up git git_filter_repo git_lfs
When I first started this blog, I simply started with experiments. The first iteration was a wordpress which was followed, very fast, by joomla. Neither of them lasted long. They are simply not for me.
I am lucky to be a part of a small group started in #dgplug on Freenode. In mentioned group, I have access to a lot of cool and awesome people who can put me to shame in development. On the flip side, I live by a motto that says:
Always surround yourself with people smarter than yourself.
It's the best way to learn. Anyway, back to the topic at hand, they introduced me to static blog generators. There my journey started but it started with a trial. I didn't give too much thought to the repository. It moved from GitHub to Gitlab and finally here.
But, of course, you know how projects go, right ?
Once you start with one, closely follows other ones that crop up along the way. I put them on my TODO, literally. One of those items was that I committed all the images to the repository. It wasn't until a few days ago until I added a .gitattributes file. Shameful, I know.
No more ! Today it all changed.
First step first
Let's talk about what we need to do a little bit before we start. Plan it out in our head before doing the actual work.
I will itemize them here to make it easy to follow:
- Clone a fresh repository to do the work in
- Remove all the images from the git repository
- Add the images again to git lfs
Sounds simple enough, doesn't it ?
Warning
If you follow along this blog post, here's what you can expect.
- You WILL lose all the files you delete from disk, as well, so make a copy
- You WILL re-write history. This means that the SHA of every commit since the first image was committed WILL mostly likely change.
- You WILL end up essentially with a new repository that shares very little similarities with the original, so BACKUP!.
Now that we got the warning out of the way, let's begin the serious work.
Clone the repository
I bet you can do this with your eyes closed by now.
$ # Backup your directory !
$ mv blog.lazkani.io blog-archive
$ git clone git@git.project42.io:Elia/blog.lazkani.io.git blog.lazkani.io
$ cd blog.lazkani.io
Easy peasy, lemon squeezy.
Remove images from history
Now, this is a tough one. Alright, let's browse.
Oh what is that thing git-filter-repo ! Alright looks good.
We can install it in different ways, check the project documentation but what I did, in a python virtual environment, was.
$ pip install git-filter-repo
Warning
BEWARE THE DRAGONS
git-filter-repo makes this job pretty easy to do.
$ git filter-repo --invert-paths --path images/
Parsed 43 commits
New history written in 0.08 seconds; now repacking/cleaning...
Repacking your repo and cleaning out old unneeded objects
HEAD is now at 17d3f5c Modifying a Nikola theme
Enumerating objects: 317, done.
Counting objects: 100% (317/317), done.
Delta compression using up to 2 threads
Compressing objects: 100% (200/200), done.
Writing objects: 100% (317/317), done.
Total 317 (delta 127), reused 231 (delta 88), pack-reused 0
Completely finished after 0.21 seconds.
That took almost no time. Nice !
Let's check the directory and fair eonugh it no longer has images/.
Add the images back !
Okay, for this you will need git-lfs. It should be easy to find your package manager. This is a debian 10 machine so I did.
$ sudo apt-get install git-lfs
Warning
Before you commit to using git-lfs, make sure that your git server supports it.
If you have a pipeline, make sure it doesn't break it.
I already stashed our original project like a big boy, so now I get to use it.
$ cp -r ../blog-archive/images .
Then we can initialize git-lfs.
$ git lfs install
Updated git hooks.
Git LFS initialized.
Okay ! We are good to go.
Next step, we need to tell git-lfs where are the files we care about. In my case, my needs are very simple.
$ git lfs track "*.png"
Tracking "*.png"
I've only used PNG images so far, so now that they are tracked you should see a .gitattributes file created if you didn't have one already.
From this step onward, git-lfs doesn't differ too much from regular git. In this case it was.
$ git add .gitattributes
$ git add images/
$ git status
On branch master
Changes to be committed:
  (use "git restore --staged <file>..." to unstage)
	modified:   .gitattributes
	new file:   images/local-kubernetes-cluster-on-kvm/01-add-cluster.png
	new file:   images/local-kubernetes-cluster-on-kvm/02-custom-cluster.png
	new file:   images/local-kubernetes-cluster-on-kvm/03-calico-networkProvider.png
	new file:   images/local-kubernetes-cluster-on-kvm/04-nginx-ingressDisabled.png
	new file:   images/local-kubernetes-cluster-on-kvm/05-customize-nodes.png
	new file:   images/local-kubernetes-cluster-on-kvm/06-registered-nodes.png
	new file:   images/local-kubernetes-cluster-on-kvm/07-kubernetes-cluster.png
	new file:   images/my-path-down-the-road-of-cloudflare-s-redirect-loop/flexible-encryption.png
	new file:   images/my-path-down-the-road-of-cloudflare-s-redirect-loop/full-encryption.png
	new file:   images/my-path-down-the-road-of-cloudflare-s-redirect-loop/too-many-redirects.png
	new file:   images/simple-cron-monitoring-with-healthchecks/borgbackup-healthchecks-logs.png
	new file:   images/simple-cron-monitoring-with-healthchecks/borgbackup-healthchecks.png
	new file:   images/weechat-ssh-and-notification/01-weechat-weenotify.png
Now that the files are staged, we shall commit.
$ git commit -v
[master 6566fd3] Re-adding the removed images to git-lfs this time
 14 files changed, 40 insertions(+), 1 deletion(-)
 create mode 100644 images/local-kubernetes-cluster-on-kvm/01-add-cluster.png
 create mode 100644 images/local-kubernetes-cluster-on-kvm/02-custom-cluster.png
 create mode 100644 images/local-kubernetes-cluster-on-kvm/03-calico-networkProvider.png
 create mode 100644 images/local-kubernetes-cluster-on-kvm/04-nginx-ingressDisabled.png
 create mode 100644 images/local-kubernetes-cluster-on-kvm/05-customize-nodes.png
 create mode 100644 images/local-kubernetes-cluster-on-kvm/06-registered-nodes.png
 create mode 100644 images/local-kubernetes-cluster-on-kvm/07-kubernetes-cluster.png
 create mode 100644 images/my-path-down-the-road-of-cloudflare-s-redirect-loop/flexible-encryption.png
 create mode 100644 images/my-path-down-the-road-of-cloudflare-s-redirect-loop/full-encryption.png
 create mode 100644 images/my-path-down-the-road-of-cloudflare-s-redirect-loop/too-many-redirects.png
 create mode 100644 images/simple-cron-monitoring-with-healthchecks/borgbackup-healthchecks-logs.png
 create mode 100644 images/simple-cron-monitoring-with-healthchecks/borgbackup-healthchecks.png
 create mode 100644 images/weechat-ssh-and-notification/01-weechat-weenotify.png
Yes, I use -v when I commit from the shell, try it.
The interesting part from the previous step is that git-filter-repo left us without a remote. As I said, this repository resembles very little the original one so the decision made by git-filter-repo is correct.
Let's add a new empty repository remote to our new repository and push.
$ git remote add origin git@git.project42.io:Elia/blog.lazkani.io.git
$ git push -u origin master

Locking support detected on remote "origin". Consider enabling it with:
  $ git config lfs.https://git.project42.io/Elia/blog.lazkani.io.git/info/lfs.locksverify true
Enumerating objects: 338, done./13), 1.0 MB | 128 KB/s
Counting objects: 100% (338/338), done.
Delta compression using up to 2 threads
Compressing objects: 100% (182/182), done.
Writing objects: 100% (338/338), 220.74 KiB | 24.53 MiB/s, done.
Total 338 (delta 128), reused 316 (delta 127), pack-reused 0
remote: Resolving deltas: 100% (128/128), done.
remote: . Processing 1 references
remote: Processed 1 references in total
To git.project42.io:Elia/blog.lazkani.io.git
 * [new branch]      master -> master
Branch 'master' set up to track remote branch 'master' from 'origin'.
And the deed is done.
Note
If you were extremely observant so war, you might've noticed that I used the same link again while I said a new repository.
Indeed, I did. The old repository was renamed and archived here. A new one with the name of the previous one was created instead.
Conclusion
After I pushed the repository you can notice the change in size. It's not insignificant. I think it's clearner now. The 1.2MB size on the repository is no longer bothering me.
DONE When is Gitea for you ? gitea git
As a platform engineer, you aim to choose the best tool for the job. Your goal is to minimize complexity as much as possible to minimize breakages and make it easier to recover. And when you think it's that simple, you get hit by the fact that the best tool for the job is determined out of a list of requirements.
Dive down with me on a thought experiment that made me choose the hidden diamond behind a lot of my projects; Gitea.
Gitea ?! What is that ?
Gitea is advertised as
Gitea is a community managed lightweight code hosting solution written in Go. It is published under the MIT license.
It is worth mentioning the bold statement the Gitea team proudly displays on the front page of the project. It reads…
Gitea - Git with a cup of tea A painless self-hosted Git service.
Why would they choose that to advertise over other things ?
If you dig in deeper into the project, you'll find that it is a golang project. It is written to be fully compiled into one binary, making deployments a breeze. It is also offered in container form.
Note
Yeah ? You read that ? I said container ! You're ears are ringing now, something inside your head started making plans on what you can do with that.
Worth mentioning projects
While talking about revision control self-hosted servers, I know most of you will shout at me if I don't talk about other options.
If you already did that, great job. Let's talk options.
Gogs
We can't talk about Gitea without mentioning Gogs, where the foremore was forked from.
The differences between both revolve, mostly, around features. They are both great projects and choosing between them goes down to what features do you need to have. But what we mention about Gitea deployment and configuration can be, mostly, applied to Gogs. One of the main missing features in Gogs is native integration with CI/CD. Hooks can be configured, though, to run pipelines if that's your preferred methond of triggering pipelines.
Gitlab
Gitlab as you can see from their webpage at date is a beast. It offers a lot more features and promises to handle your workflow. It comes with its own CI/CD. It also offers integration with a bootload of different projects right and left. You might, also, be interested to hear more if you're running Kubernetes.
It is also worth mentioning the slew of options offered to run Gitlab in the cloud. Making deployment and management a lot easier.
After reading all that, you might want to ask what the catch is. Well the catch is, unfortunately, complexity. It also requires more resources. This needs to be taken into account, especially in the cloud. Bottom line is, it will cost more.
Requirements
We, finally, get to the most important part of our project. We need to sit down and figure out our requirements. It is impossible to start any project without defining the requirements and the resources at our disposal. A few good questions to find answers to.
- What do I need this server for ?
- How big is my company ?
- How big is this server supposed to be ?
- How many repositories is it supposed to hold ?
- Where am I going to be deploying it ?
- What kind of integration do I need out of it ?
- How do I back it up ?
- How do I recover it ?
- How do I monitor it ?
- What can I afford ?
Warning
If you're not thinking about how to back your server up, recover it and monitor it, you're doing it wrong !
Small company
If you're an individual or a small company, you probably have a small set of repositories. Your needs depend on the features you require, at that point. If you want a simple server that "just works", with reservations on the term. Then I would suggest Gogs or Gitea. They require limited resources and can handle a good amount of beating. There is nothing stopping you from going with Gitlab, but know that you will have to deal with the complexity of its management. Only you can decide whether this is worth it and how much complexity your team can handle among other infrastructure services they have to offer.
If you require native integration with CI/CD, then your choices go down to Gitea and Gitlab. If you want to be able to offer pages feature or native Kubernetes integration, then your option is limited to one; Gitea. But if those are not required and you have free rein over CI/CD and your requirement set is met by the integration offered by Gitea, there is no reason to choose anything else at that point simply because "everyone is using that tool". That's a bad reason !
Let's not forget the cost ! This is a big factor for small companies. If you can go by with a smaller instance running Gitea, it wouldn't make financial sense to run something that would require bigger tiers and thus cost more.
Medium to big company
Now, we're talking more complex requirements. We might be talking one big monolith for the whole company. We are definitely talking more features and more integrations with different tools. The options in this case can range from a bare git server all the way to propiarty tools.
If we're going to stick with the open source projects we mentioned so far. Gitea could squeeze into the medium company with all of its features but Gitlab definitely hits spot for most cases. If you're medium to big, you already made peace with the fact that you will handle complexity here. I would say try to study the case out of curiosity but you already know my answer. You know you have one choice here and the choice is Gitlab.
Note
It is worth noting here that I am assuming integration with LDAP (or some other authentication system), complex CI/CD, Kubernetes integration and much more.
If you're at this level, I'm assuming cost has a bigger margin than with smaller companies. You understand that the infrastructure needed is bigger to accomodate all of your engineers and the increase in cost is also expected. Entertaining the idea of limiting cost at this point is still valid, you have the best interest of your company as well after all.
Deployment
At this stage, you're already decided on the tool you'll be using moving forward. It meets all the requirements derived from the needs of the teams that are going to be using. It also meets your standards of complexity and stability.
Note
It is worth mentioning here that you should test the tools you're considering in a few POC trials. Get familiarised with it and the way it works. How is it configured, and if it suits your configuration method of choice.
You'll get the chance to test it thoroughly during the UAT round. You'll be attempting to break it and determine it's breaking point and behaviour.
It is crucial to get familiarised with the system you'll be managing. Get comfortable with it.
After that ramble, let's look at a few options of deploying each. I'm sure there are many different ways I will not think of, but they are all determined by the enviornment they are going to be deployed in.
Gitea/Gogs
These two projects come in binary form, easy to curl and run. It can also be
deployed in a container format.
One can use docker-compose or configuration management to manage the
containers.
You can automate the deployment, the backup, the restore and the monitoring easily. It can be done on a single box with external storage, it can also be done in Kubernetes with Persisent Volumes.
If you're big enough, you can even entertain the idea of offering it as a service for teams to deploy on their own.
These two projects offer a versatility of deployments, choose which one fits your environment and workflow best.
Gitlab
If we want to dig into the different methods in which you can deploy Gitlab, we'll need pages. In fact, Gitlab already has pages written on the different ways to deploy it.
They also have ways to do backup, restore and a way to monitor it. The documentation is extensive and so are the different ways of deployment, from bare metal all the way to Kubernetes.
Give yourself a bit more time to get familiarised with Gitlab before you jump in. Get comfortable with it, take your time. Find your comfort zone. Always refer to the documentation.
My choice
If you've been following this blog for a while, you already know I chose Gitea.
From the previous thought experiment, I deduced that Gitea or Gogs both fit my needs as an individual. They offer me all the features I require from a revision control server. They are simple and don't require too much maintenance. They are also cheap to run. I don't need a big server to run them, I save on my pocket !
The reason I chose Gitea over Gogs was the CI/CD native integration. I wanted to use CI/CD pipelines for my projects. In fact, this very blog is built using a pipeline integrated with Gitea.
I've been running Gitea for a few years now. I've grown fond of it. Upgrading is a breeze, it's basically changing a number. It has been rock solid all of these years and haven't given me grief. In fact, the only time I had issues with it was when I was determining the memory requirements of the database and the database kept crashing.
To top it off, backup is easy and so is restoration. I've, also, done a few migrations on the server over the years as it grew. I've got comfortable with it.
And to answer your final question, yes, I am monitoring it. Gitea exports Prometheus metrics. And yes, I get paged for it when it gets down. Why ? Because I can. And because I am that kind of engineer.
Conclusion
When deciding on a tool to use, don't let your preference cloud your judgement. Be analytical in your approach and base it on requirements. Make your requirements clear and known as they are your guidance towards the right tool. Do not be afraid to take your time with it, run a few POCs. Play around with the project a bit, this time is valuable and could save you loads of headaches later on. Gather as much information as possible and assess how well this tool fits your needs. The best tool is the one that fits your needs best. End of story !
RSS @rss
DONE Yet Another RSS Reader Move ? emacs org_mode configuration
The more I get comfortable with emacs and doom, the more I tend to move things to it. This means that I am getting things done faster, without the need to get bogged down in the weeds of things.
This also means that, sometimes, I get to decommission a service that I host for my own personal use. If I can do it with a text file in git, why would I host a full-on service to do it for me ?
You might say, well, then you can access it from anywhere ! Security much ?!
if I don't have my machine, I will not access my passwords. In practice, the reality is that I am tied to my own machine. On one hand, I cannot access my services online without my machine and if I am on the move it is highly unlikely for me to access my rss.
Oh yeah ! rss ! That's what we are here for right ? Let's dive in…
Introduction
I hosted an instance of miniflux on a vps for my rss. Miniflux is a great project, I highly recommend it. I have used it for a number of years without any issues at all; hassle free. I love it !
But with time, we have to move on. I have had my eye on the rss configuration in the doom init.el since I installed it. Now comes the time for me to try it out.
I will go with my process with you so you can see what I did. There might be better ways of doing things than this, if you know how ping me !
Doom documentation
The nice thing about doom is that it is documented. The rss is a doom module so we will look in the doom modules manual.
We can achieve this by hitting SPC h d m and then searching for rss. The documentation will give us a bit of informaton to get started, like for example that it uses elfeed as a package.
Elfeed
The creators of elfeed describe it as.
… an extensible web feed reader for Emacs, supporting both Atom and RSS.
The project looks well documented, that's very good. It has extensions, org one… wait org one ? What does it do ?
Elfeed Org
What is this thing elfeed-org ?
Configure the Elfeed RSS reader with an Orgmode file
Sweet ! That's what I'm talking about. A neatly written org file as configuration.
It is always a good idea to go through documentation, at least quickly. Skim it over, you don't know what you would miss in there. I've been doing this for a long time, there is no way I can miss any… oh wait… I missed this…
Import/Export OPML?
Whaaaat ?
Use
elfeed-org-import-opmlto import an OPML file to an elfeed-org structured tree.
Alright, that sounds easy. Let's export from miniflux and import in elfeed.
Configuration
Before we import and whatnot, let's figure out what we are importing and where.
After reading the documentation of both elfeed and elfeed-org, it says we need to set rmh-elfeed-org-files which is a list.
In my doom configuration, I think I need to do the following.
(after! elfeed
  (elfeed-org)
  (setq rmh-elfeed-org-files (list "~/path/to/elfeed.org")))
This way we can guarantee where the file is, or we can go digging where the default is and copy from there. This is just another file in my org collection. Nothing special about it, it gets tagged and searched like everything else.
Note
I added the (elfeed-org) in the block to load elfeed-org after I had to load it manually a few times. This made it work on my system, I might be doing it wrong so your milage may vary.
The after! section is doom specific.
I also added the following line above the rmh-elfeed-org-files line.
(setq elfeed-search-filter "@1-month-ago")I simply wanted to see a span of a month instead of the default 2 weeks.
The end result configuration is as follows.
(after! elfeed
  (elfeed-org)
  (setq elfeed-search-filter "@1-month-ago")
  (setq rmh-elfeed-org-files (list "~/path/to/elfeed.org")))
Warning
This is the time where you reload your configuration, reload emacs and then reload the world.
If you are not using doom, only setq lines and do not forget to manually load the packages before callind them.
Importing
I think this is going to be a nightmare. It says on the page M-x then elfeed-org-import-opml, yeah right !
Alright let's do that. It prompts for the file, we give it the file and nothing happens…
Let's look in our elfeed.org file and whaaaa ! It's all here. That is awesome ! And here I was, the doubter, all along.
Now, let's move things around, tag them properly and categorize them as we please.
For all of you who are not importing, here's how mine, snippitized, looks like.
 * Elfeeds :elfeed:
 ** Bloggers :blog:
 *** [[https://blog.lazkani.io/rss.xml][The DevOps Blog]] :personal:
 ** Websites
 *** News :news:
 **** General :general:
 ***** [[https://www.reddit.com/r/worldnews/.rss][Reddit: World News]] :world:reddit:
 ***** [[https://www.reddit.com/r/europe/.rss][Reddit: Europe News]] :europe:reddit:
 **** Technology :technology:
 ***** [[https://www.reddit.com/r/technology/.rss][Reddit: Technology]] :reddit:
 *** [[https://xkcd.com/rss.xml][xkcd]] :xkcd:
Granted, it is not much the looker in this mode but a picutre will reveal far better results, I presume. Don't you think ?
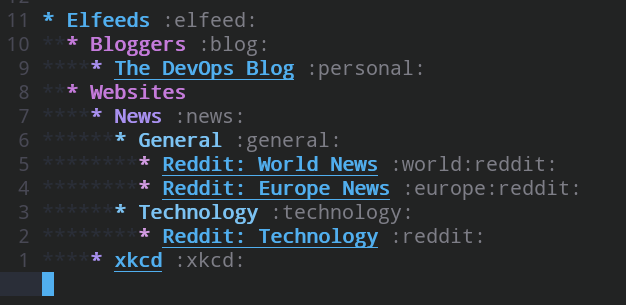
Oh yeah, now we're talking !
Why the hierarchy ?
Elfeed-org by default inherits tagging and ignores text. In this way, I can cascade tags and when it's time to sort I can search for +xkcd and I get only xkcd posts. I can also do something similar to filter on +general +europe for specifically getting Europe's Reddit news.
The other reason for the org integration is the documentation aspect for the future. I have only recently migrated to elfeed so the documentation is still somewhat lacking, even for me. Not to worry though, as is the custom with the other migrations so far I ended up documenting a lot of it in better ways.
The big finish ?
Okay, okay ! That's a lot of babbling let's get to it, shall we ?
Now that everything is configured the way we like. Let's reload everything and try M-x elfeed.
Yeah, I know not very impressive huh ? We didn't add any hooks to update and fetch things. I like to do that manually. The documentation, though, describes how to do that, if you like. For now, let's do it ourselves M-x elfeed-update. You should be greeted with something like this.

Looks nice huh ?! Not bad at all.
Conclusion
There was nothing hard about the setup, whatsoever. It took me a bit to go through the relevant bits of the documentation for my use cases which are, I admit, simple. I can now decommission my miniflux instance as I have already found my future rss reader.
IRC @irc
DONE Weechat, SSH and Notification weechat notification ssh
I have been on IRC for as long as I have been using Linux and that is a long time. Throughout the years, I have moved between terminal IRC clients. In this current iteration, I am using Weechat.
There are many ways one can use weechat and the one I chose is to run it in tmux on a cloud server. In other words, I have a Linux server running on one of the many cloud providers on which I have tmux and weechat installed and configured the way I like them. If you run a setup like mine, then you might face the same issue I have with IRC notifications.
Why?
Weechat can cause a terminal bell which will show on some terminals and window managers as a notification. But you only know that weechat pinged. Furthermore, if this is happening on a server that you are ssh'ing to, and with various shell configurations, this system might not even work. I wanted something more useful than that so I went on the hunt for the plugins available to see if any one of them could offer me a solution. I found many official plugins that did things in a similar fashion and each in a different and interesting way but none the way I want them to work.
Solution
After trying multiple solutions offered online which included various plugins, I decided to write my own. That's when weenotify was born. If you know my background then you know, already, that I am big on open source so weenotify was first released on Gitlab. After a few changes, requested by a weechat developer (FlashCode in #weechat on Freenode), weenotify became as an official weechat plugin.
Weenotify
Without getting into too many details, weenotify acts as both a weechat plugin and a server. The main function is to intercept weechat notifications and patch them through the system's notification system. In simple terms, if someone mentions your name, you will get a pop-up notification on your system with information about that. The script can be configured to work locally, if you run weechat on your own machine, or to open a socket and send the notification to weenotify running as a server. In the latter configuration, weenotify will display the notification on the system the server is running on.
Configuration
Let's look at the configuration to accomplish this… As mentioned in the beginning of the post, I run weechat in tmux on a server. So I ssh to the server before attaching tmux. The safest way to do this is to port forward over ssh and this can be done easily by ssh'ing using the following example.
$ ssh -R 5431:localhost:5431 server.example.com
At this point, you should have port 5431 forwarded between the server and your machine.
Once the previous step is done, you can test if it works by trying to run the weenotify script in server mode on your machine using the following command.
 $ python weenotify.py -s
 Starting server...
 Server listening locally on port 5431...
The server is now running, you can test port forwarding from the server to make sure everything is working as expected.
 $ telnet localhost 5431
 Trying ::1...
 Connected to localhost.
 Escape character is '^]'.
If the connection is successful then you know that port forwarding is working as expected. You can close the connection by hitting Ctrl + ].
Now we are ready to install the plugin in weechat and configure it. In weechat, run the following command.
/script search weenotify
At which point, you should be greeted with the buffer shown in the screenshot below.

You can install the plugin with Alt + i and make sure it autoloads with Alt + A.
You can get more information about working with weechat scripts by reading the help menu.
You can get the scripts help menu by running the following in weechat.
/help script
The weenotify plugin is installed at this stage and only needs to be configured. The plugin has a list of values that can be configured. My configuration looks like the following.
 plugins.var.python.weenotify.enable  string  "on"
 plugins.var.python.weenotify.host    string  "localhost"
 plugins.var.python.weenotify.mode    string  "remote"
 plugins.var.python.weenotify.port    string  "5431"
Each one of those configuration options can be set as shown in the example below in weechat.
/set plugins.var.python.weenotify.enable on
Make sure that the plugin enable value is on and that the mode is remote, if you're following this post and using ssh with port forwarding. Otherwise, If you want the plugin to work locally, make sure you set the mode to local.
If you followed this post so far, then whenever someone highlights you on weechat you should get a pop-up on your system notifying you about it.
DONE Weechat and Emacs weechat emacs weechat_el
In the last few blog posts, I mentioned a few migrations caused by my VSCode discovery a few weeks ago #emacs-and-org-mode.
As I was configuring Doom, I noticed that there was a configuration for weechat in there. I checked it out very briefly and found that it was a weechat.el package for Emacs.
At the time, I didn't have too much time to spend on this so I quickly passed it over with plans to come back to it, eventually.
The time has come for me to configure and try this at least !
I already have my weechat installation running remotely behind an nginx reverse proxy. I tried to connecting using that endpoint, unfortunately no dice.
The Problem
As I was asking in #weechat.el on freenode for help, the very quick to help FlashCode sprung into action. He wasn't able to help me but he pointed me in the right direction.
I asked why would Glowing Bear work but not weechat.el ?
The answer was along the line that Glowing Bear uses a websocket. Alright that made sense. Maybe weechat.el does not do websocket.
The Solution
So, we are behind an nginx reverse proxy instance. What we need to do is expose our service as a TCP reverse proxy instead of our usual HTTP one. We are moving down networking layers to the TCP/IP instead of HTTP.
What we need to do is add a stream section to our nginx to accomplish this.
stream {
    server {
        listen 9000 ssl;
        ssl_certificate /path/to/chain.pem;
        ssl_certificate_key /path/to/cert.pem;

        proxy_pass 127.0.0.1:9000;
    }
}
Warning
The stream section has to be outside the http section.
If you add this configuration next to your other server sections, it will fail.
In the previous block we make a few assumptions.
- We are behind SSL: I use the nginx reverse proxy for SSL termination as it handles reloading certificates automatically. If I leave it to weechat, I have to reload the certificates manually and often.
- Weechat is listening on port 9000 locally: The weechat relay needs to be configured to listen on localhost and on port 9000 for this configuration to work. Make sure to change it to fit your needs.
Now that the configuration is out of the way, let's test it.
Open emacs and run M-x followed by weechat-connect. This should get you going.
Conclusion
It was a nice path down the road of packets. It's always a good day when you learn new things. I have never used TCP forwarding with nginx before but I'm glad it is supported.
Now that you know how to do the same as well, I hope you give both projects a try. I think they are worth it.
I'm also thankful to have so many different awesome projects created by the open source community.
Text Editors @text_editors
DONE Emacs and Org-mode emacs org_mode configuration
I have recently found out, late I know, that the VSCode distribution of the so called Code - OSS is exactly that; a distribution.
Let me make it clear, the VSCode binaries you download from Microsoft has an upstream the GitHub repository named VSCode but in fact is not exactly the same code. Microsoft has already added a few gifts for you, including telemetry, not cool huh ?! Well, they tell you this in the documentation, urrrmmm somewhere.
At the same time, I was giving Jupyter Notebook a try. I worked on my previous post in it before writing down the final result as a blog post. But at the back of my mind, there was always Org-mode.
Putting one and one together, you've guessed it. I have moved to Emacs… again… for the umm I can't remember time. But this time, it is different ! I hope…
Back story
I was using Jupyter Notebooks as a way to write down notes. Organize things. I had a work around the output and was able to clean it. But let's face it, it might work but it is designed more towards other goals. I want to write notes and the best way to work with notes is to keep in the text, literally. I found a VSCode extension that can handle Org-mode in some capacity (I haven't tested it) so I decided to switch to Emacs and keep the extention as a backup.
Emacs Distribution of Doom
Haha ! Very funny, I know. I went with Doom. Why? You may ask. I don't really have a good answer for you except the following.
- I didn't want to start from scratch, I wanted something with batteries included.
- At the same time, I've tried Doom before and I like how it does things. It is logical to me while at the same time very configurable.
- I was able to get up and running very quickly. Granted, my needs are few.
- I got Python and Golang auto-completion and evil mode. I'm good to go !
Now let's dig down to my main focus here. Sure I switched editors but it was for a reason; Org-mode.
Org-mode Configuration
I will be talking about two different configuartion options here. I am new to emacs so I will try to explain everything.
The two options are related to the difference between a vanilla configuration and Doom's version of the configuration. The differences are minor but they are worth talking about.
New Org File
If you've used Org-mode before and created org files, you already know that you need to set a few values at the top of the file. These include the title, author, description and a different other values to change setting and/or behavior.
It is a bit of a manual labor to write these few lines at the beginning of every file. I wanted to automate that. So I got inspiration from shakthimaan.
I used his method to create a small define-skeleton for a header.
It looks something like this.
(define-skeleton generate-new-header-org
"Prompt for title, description and tags"
nil
'(setq title  (skeleton-read "Title: "))
'(setq author  (skeleton-read "Author: "))
'(setq description  (skeleton-read "Description: "))
'(setq tags (skeleton-read "tags: "))
"#+TITLE: " title \n
"#+AUTHOR: " author \n
"#+DESCRIPTION: " description \n
"#+TAGS: " tags \n
)
You can use this later with M-x + genrate-new-header-org.
Note
M-x is the Meta key and x combination.
Your Meta key can differ between the Alt on Linux and Command on Mac OS X.
M-x will open a prompt for you to write in. Write the name you gave the skeleton, in this case it is generate-new-header-org and then hit the Return.
New Task
shakthimaan already created something for this. It looks like the following.
;; Create a new skeleton to generate a new =Task=
(define-skeleton insert-org-entry
"Prompt for task, estimate and category"
nil
'(setq task  (skeleton-read "Task: "))
'(setq estimate  (skeleton-read "Estimate: "))
'(setq owner  (skeleton-read "Owner: "))
'(setq category (skeleton-read "Category: "))
'(setq timestamp (format-time-string "%s"))
"** " task \n
":PROPERTIES:" \n
":ESTIMATED: " estimate \n
":ACTUAL:" \n
":OWNER: " owner \n
":ID: " category "." timestamp \n
":TASKID: " category "." timestamp \n
":END:")
This can also be used like the one above with M-x + insert-org-entry.
Doom specific configuration
Whatever defined so far should work if you just add it to your configuration but if you use Doom it would a nice touch to integrate it with the workflow.
In ~/.doom.d/config.el, wrap the previous definitions with (after! org).
It's a nice touch to add these skeletons after Org-mode has loaded.
(after! org
;; Create a skeleton to generate header org
(define-skeleton generate-new-header-org
    "Prompt for title, description and tags"
    nil
    '(setq title  (skeleton-read "Title: "))
    '(setq author  (skeleton-read "Author: "))
    '(setq description  (skeleton-read "Description: "))
    '(setq tags (skeleton-read "tags: "))
    "#+TITLE: " title \n
    "#+AUTHOR: " author \n
    "#+DESCRIPTION: " description \n
    "#+TAGS: " tags \n)

;; Create a new skeleton to generate a new =Task=
(define-skeleton insert-org-entry
    "Prompt for task, estimate and category"
    nil
    '(setq task  (skeleton-read "Task: "))
    '(setq estimate  (skeleton-read "Estimate: "))
    '(setq owner  (skeleton-read "Owner: "))
    '(setq category (skeleton-read "Category: "))
    '(setq timestamp (format-time-string "%s"))
    "** " task \n
    ":PROPERTIES:" \n
    ":ESTIMATED: " estimate \n
    ":ACTUAL:" \n
    ":OWNER: " owner \n
    ":ID: " category "." timestamp \n
    ":TASKID: " category "." timestamp \n
    ":END:")
)
Warning
If you modify any file in ~/.doom.d/, do not forget to run doom sync and doom doctor to update and check your configuration respectively.
Final touches
I wanted to add it to the menu system that comes with Doom so I included the following in my (after! ...) block.
;; Add keybindings with the leader menu for everything above
(map! :map org-mode-map
    (:leader
        (:prefix ("m", "+<localleader>")
        :n :desc "Generate New Header Org" "G" 'generate-new-header-org
        :n :desc "New Task Entry" "N" 'insert-org-entry
        ))
)
Making the final configuration look like the following.
(after! org
;; Create a skeleton to generate header org
(define-skeleton generate-new-header-org
    "Prompt for title, description and tags"
    nil
    '(setq title  (skeleton-read "Title: "))
    '(setq author  (skeleton-read "Author: "))
    '(setq description  (skeleton-read "Description: "))
    '(setq tags (skeleton-read "tags: "))
    "#+TITLE: " title \n
    "#+AUTHOR: " author \n
    "#+DESCRIPTION: " description \n
    "#+TAGS: " tags \n)

;; Create a new skeleton to generate a new =Task=
(define-skeleton insert-org-entry
    "Prompt for task, estimate and category"
    nil
    '(setq task  (skeleton-read "Task: "))
    '(setq estimate  (skeleton-read "Estimate: "))
    '(setq owner  (skeleton-read "Owner: "))
    '(setq category (skeleton-read "Category: "))
    '(setq timestamp (format-time-string "%s"))
    "** " task \n
    ":PROPERTIES:" \n
    ":ESTIMATED: " estimate \n
    ":ACTUAL:" \n
    ":OWNER: " owner \n
    ":ID: " category "." timestamp \n
    ":TASKID: " category "." timestamp \n
    ":END:")

(map! (:when (featurep! :lang org)
    (:map org-mode-map
    (:localleader
        :n :desc "Generate New Header Org" "G" 'generate-new-header-org
        :n :desc "New Task Entry" "N" 'insert-org-entry
        ))
    ))
)
What do I do now ?
You might be asking yourself at this point, what does this all mean ? What do I do with this ? Where do I go ?
Well here's the thing. You find yourself wanting to create a new org file.
You do so in emacs and follow it with M-x + generate-new-header-org (or SPC m G in Doom). Emacs will ask you a few questions in the bottom left corner and once you answer then, your header should be all set.
You can follow that with M-x + insert-org-entry (or SPC m N) to generate a task. This will also ask you for input in the bottom left corner.
Conclusion
This should help me pick up the usage of Org-mode faster. It is also a good idea if you've already configured your Emacs to read all your org file for a wider agenda view.
DONE Literate Programming Emacs Configuration emacs org_mode configuration
I was working on a project that required a lot of manual steps. I generally lean towards automating everything but in some cases that is, unfortunately, not possible.
Documenting such project is not an easy task to accomplish, especially with so many moving parts and different outputs.
Since I have been using org-mode more frequently for documentation and organization in general, I gravitated towards it as a first instinct.
I wasn't sure of the capabilities of org-mode in such unfamiliar settings but I was really surprised by the outcome.
Introduction
If you haven't checked org-mode already, you should.
As its main capability it is to keep it simple for writing things down and organizing them, org-mode is great to keep track of the steps taking along the way.
The ability to quickly move between plain text and into code blocks is excellent. Coupling org-mode with org-babel gives you the ability to run the source code blocks and get the output back into the org file itself. That is extremely neat.
With those two abilities alone, I could document things as I go along. This included both the commands I am running and the output I got back. Fantastic.
After some search online, I found out that this method is called literal coding. It consists of having the plain text documentation and the code in the same file and with the help of both previously mentioned emacs packages one can get things working.
That sounds like fun!
Emacs Configuration
After digesting all the information I mentioned so far, that got me thinking. What about emacs?
A quick look online got me the answer. It is possible to do with emacs as well. Alright, let's get right into it shall we ?
First step, I added the following line to my main configuration. In my case, my main configuration file is the doom distribution's configuration file.
(org-babel-load-file "~/path/to/my/configuration.org")Warning
Make sure org-mode and org-babel are both installed and configured on your system before trying to run org-babel-load-file
Org-mode Conversion
After I pointed my main emacs configuration to the org configuration file I desire to use, I copied all the content of my main emacs configuration in an emacs-lisp source code block.
#+BEGIN_SRC emacs-lisp
... some code ...
#+END_SRC
I, then, reloaded my emacs to double check that everything works as expected and it did.
Document the code
Now that we have everything in one org file, we can go ahead and start documenting it. Let's see an example of before and after.
I started small, bits and pieces. I took a snippet of my configuration that looked like the following.
#+BEGIN_SRC emacs-lisp
(setq display-line-numbers-type t)
(setq display-line-numbers-type 'relative)
(after! evil
   (map! :map evil-window-map
         (:leader
          (:prefix ("w" . "Select Window")
           :n :desc "Left"  "<left>" 'evil-window-left
           :n :desc "Up"    "<up>" 'evil-window-up
           :n :desc "Down"  "<down>" 'evil-window-down
           :n :desc "Right" "<right>" 'evil-window-right))))
#+END_SRC
I converted it to something that looks very familiar to org users out there.
* Line Numbering
** Enable line numbering
   Enabling line numbering by turning the flag on.
   #+BEGIN_SRC emacs-lisp
(setq display-line-numbers-type t)
   #+END_SRC

** Configure /relative/ line numbering
   Let's also make sure it's the /relative/ line numbering.
   This helps jumping short distances very fast.
   #+BEGIN_SRC emacs-lisp
(setq display-line-numbers-type 'relative)
   #+END_SRC

* Evil
** Navigation
   I'd like to use the /arrows/ to move around. ~hjkl~ is not very helpful or pleasant on /Colemak/.
   #+BEGIN_SRC emacs-lisp
(after! evil
  (map! :map evil-window-map
        (:leader
         (:prefix ("w" . "Select Window")
          :n :desc "Left"  "<left>" 'evil-window-left
          :n :desc "Up"    "<up>" 'evil-window-up
          :n :desc "Down"  "<down>" 'evil-window-down
          :n :desc "Right" "<right>" 'evil-window-right))))
   #+END_SRC
It might not be much a looker in such a block, but trust me, if you have an org-mode parser it will make total sense. It will export to html very well too.
Most importantly, the emacs configuration still works.
Conclusion
I went through my emacs configuration and transformed it into a documented org file. My configuration looks a little bit neater now and that's great.
The capabilities of literal programming goes way beyond this post, which goes without saying, and this is not the only use case for it.
DONE Bookmark with Org-capture org_mode emacs org_capture org_web_tools org_cliplink
I was reading, and watching, Mike Zamansky's blog post series about org-capture and how he manages his bookmarks. His blog and video series are a big recommendation from me, he is teaching me tons every time I watch his videos. His inspirational videos were what made me dig down on how I could do what he's doing but… my way…
I stumbled across this blog post that describes the process of using org-cliplink to insert the title of the post into an org-mode link. Basically, what I wanted to do is provide a link and get an org-mode link. Sounds simple enough. Let's dig in.
Org Capture Templates
I will assume that you went through Mike's part 1 and part 2 posts to understand what org-capture-templates are and how they work. I essentially learned it from him and I do not think I can do a better job than a teacher.
Now that we understand where we need to start from, let's explain the situation. We need to find a way to call org-capture and provide it with a template. This template will need to take a url and add an org-mode url in our bookmarks. It will look something like the following.
(setq org-capture-templates
      '(("b" "Bookmark (Clipboard)" entry (file+headline "~/path/to/bookmarks.org" "Bookmarks")
         "** %(some-function-here-to-call)\n:PROPERTIES:\n:TIMESTAMP: %t\n:END:%?\n" :empty-lines 1 :prepend t)))
I formatted it a bit so it would have some properties. I simply used the %t to put the timestamp of when I took the bookmark. I used the %? to drop me at the end for editing. Then some-function-here-to-call a function to call to generate our bookmark section with a title.
The blog post I eluded to earlier solved it by using org-cliplink. While org-cliplink is great for getting titles and manipulating them, I don't really need that functionality. I can do it manually. Sometimes, though, I would like to copy a page… Maybe if there is a project that could attempt to do someth… Got it… org-web-tools.
Configuring org-capture with org-web-tools
You would assume that you would be able to just pop (org-web-tools-insert-link-for-url) in the previous block and you're all done. But uhhh….
Wrong number of arguments: (1 . 1), 0
No dice. What would seem to be the problem ?
We look at the definition and we find this.
(defun org-web-tools-insert-link-for-url (url)
  "Insert Org link to URL using title of HTML page at URL.
If URL is not given, look for first URL in `kill-ring'."
  (interactive (list (org-web-tools--get-first-url)))
  (insert (org-web-tools--org-link-for-url url)))
I don't know why, exactly, it doesn't work by calling it straight away because I do not know emacs-lisp at all. If you do, let me know. I suspect it has something to do with (interactive) and the list provided to it as arguments.
Anyway, I can see it is using org-web-tools--org-link-for-url, which the documentation suggests does the same thing as org-web-tools-insert-link-for-url, but is not exposed with (interactive). Okay, we have bits and pieces of the puzzle. Let's put it together.
First, we create the function.
(defun org-web-tools-insert-link-for-clipboard-url ()
  "Extend =org-web-tools-inster-link-for-url= to take URL from clipboard or kill-ring"
  (interactive)
  (org-web-tools--org-link-for-url (org-web-tools--get-first-url)))
Then, we set our org-capture-templates variable to the list of our only item.
(setq org-capture-templates
      '(("b" "Bookmark (Clipboard)" entry (file+headline "~/path/to/bookmarks.org" "Bookmarks")
         "** %(org-web-tools-insert-link-for-clipboard-url)\n:PROPERTIES:\n:TIMESTAMP: %t\n:END:%?\n" :empty-lines 1 :prepend t)))
Now if we copy a link into the clipboard and then call org-capture with the option b, we get prompted to edit the following before adding it to our bookmarks.
 ** [[https://cestlaz.github.io/stories/emacs/][Using Emacs Series - C'est la Z]]
 :PROPERTIES:
 :TIMESTAMP: <2020-09-17 do>
 :END:
Works like a charm.
Custom URL
What if we need to modify the url in some way before providing it. I have that use case. All I needed to do is create a function that takes input from the user and provide it to org-web-tools--org-link-for-url. How hard can that be ?! uhoh! I said the curse phrase didn't I ?
(defun org-web-tools-insert-link-for-given-url ()
"Extend =org-web-tools-inster-link-for-url= to take a user given URL"
(interactive)
(let ((url (read-string "Link: ")))
(org-web-tools--org-link-for-url url)))
We can, then, hook the whole thing up to our org-capture-templates and we get.
(setq org-capture-templates
'(("b" "Bookmark (Clipboard)" entry (file+headline "~/path/to/bookmarks.org" "Bookmarks")
"** %(org-web-tools-insert-link-for-clipboard-url)\n:PROPERTIES:\n:TIMESTAMP: %t\n:END:%?\n" :empty-lines 1 :prepend t)
("B" "Bookmark (Paste)" entry (file+headline "~/path/to/bookmarks.org" "Bookmarks")
"** %(org-web-tools-insert-link-for-given-url)\n:PROPERTIES:\n:TIMESTAMP: %t\n:END:%?\n" :empty-lines 1 :prepend t)))
if we use the B, this time, it will prompt us for input.
Configure org-capture with org-cliplink
Recently, this setup has started to fail and I got contacted by a friend pointing me to my own blog post. So I decided to fix it. My old setup used to use org-cliplink but I moved away from it for some reason. I cannot remember why. It is time to move back to it.
In this setup, I got rid of the custom function to get the link manually. I believe that is why I moved but I cannot be certain. Anyway, nothing worked so why keep something not working right ?
All this means is that we only need to setup our org-capture-templates. We can do so as follows.
(setq org-capture-templates
'(("b" "Bookmark (Clipboard)" entry (file+headline "~/path/to/bookmarks.org" "Bookmarks")
"** %(org-cliplink)\n:PROPERTIES:\n:TIMESTAMP: %t\n:END:%?\n" :empty-lines 1 :prepend t)
Now, you should have a working setup… org-cliplink willing !
Conclusion
I thought this was going to be harder to pull off but, alas, it was simple, even for someone who doesn't know emacs-lisp, to figure out. I hope I'd get more familiar with emacs-lisp with time and be able to do more. Until next time, I recommend you hook org-capture into your workflow. Make sure it fits your work style, otherwise you will not use it, and make your path a more productive one.
DONE Calendar Organization with Org emacs org_mode calendar organization
I have been having some issues with my calendar. Recurring stuff have been going out of wack for some reason. In general, the setup I've had for the past few years have now become a problem I need to fix.
I decided to turn to my trusted emacs, like I usually do. Doom comes bundled with something. Let's figure out what it is and how to configure it together.
Calendar in Emacs
I dug deeper into Doom's Calendar module and I found out that it is using calfw.
I went to GitHub and checked the project out. It's another emacs package, I'm going to assume you know how to install it.
Let's look at the configuration example.
(require 'calfw-cal)
(require 'calfw-ical)
(require 'calfw-howm)
(require 'calfw-org)
(defun my-open-calendar ()
(interactive)
(cfw:open-calendar-buffer
:contents-sources
(list
(cfw:org-create-source "Green") ; orgmode source
(cfw:howm-create-source "Blue") ; howm source
(cfw:cal-create-source "Orange") ; diary source
(cfw:ical-create-source "Moon" "~/moon.ics" "Gray") ; ICS source1
(cfw:ical-create-source "gcal" "https://..../basic.ics" "IndianRed") ; google calendar ICS
)))That looks like an extensive example. We don't need all of it, I only need the part pertaining to org.
Configuration
The example looks straight forward. I'm going to keep only the pieces I'm interested in. The configuration looks like the following.
(require 'calfw-cal)
(require 'calfw-org)
(defun my-blog-calendar ()
(interactive)
(cfw:open-calendar-buffer
:contents-sources
(list
(cfw:org-create-file-source "Blog" "~/blog.org" "Orange") ; our blog organizational calendar
)))
That was easy. but before we jump to the next step, let's talk a bit about what we just did.
We, basically, created a new function which we can call later with M-x to open our calendar.
We configured the function to include the org files we want it to keep track of.
In this case, we only have one. We named it Blog and we gave it the color Orange.
Creating our org file
After we have configured calfw, we can create the blog.org file.
#+TITLE: Blog
#+AUTHOR: Who
#+DESCRIPTION: Travels of Doctor Who
#+TAGS: organizer organization calendar todo tasks
* Introduction
This is the /calendar/ of *Dr Who* for the next week.
* Travels
** DONE Travel to Earth 1504
CLOSED: <2021-07-03 za 09:18> SCHEDULED: <2021-07-02 vr>
- CLOSING NOTE <2021-07-03 za 09:18> \\
The doctor already traveled to earth /1504/ for his visit to the /Mayans/.
A quick visit to the /Mayan/ culture to save them from a deep lake monster stealing all their gold.
** TODO Travel back to Earth 2021
SCHEDULED: <2021-07-04 zo>
Traveling back to earth 2021 to drop the companion before running again.
** TODO Travel to the Library
SCHEDULED: <2021-07-04 zo>
The doctor visits the /Library/ to save it again from paper eating bacteria.
** TODO Travel to Midnight
SCHEDULED: <2021-07-08 do>
The doctor visits *Midnight* in the /Xion System/.
** TODO Travel to Earth 2021
SCHEDULED: <2021-07-09 vr>
Snatching back the companion for another travel advanture.Let's get the party started
Now that we have everything set into place. We can either reload emacs or simply run the code snippet that declares our function.
Next step is checking out if it works. Let's run M-x then call our function my-blog-calendar.

If we go to a date with hjkl and hit return or enter, we get to see what we have to work with.

We can take a look at closed items with time too.

That looks pretty nice.
Conclusion
I thought it was going to be more extensive to configure the calendaring feature in emacs. I couldn't be further away from the truth. Not only was it a breeze to configure, it was even easier to create the calendar and maintain it. If you are already familiar with org, then you're already there. Point the calendar to your org file, iCal file or even Google Calendar link and you're all set. The bottom line of working with org is the ease of use, to me. If you already use it to organize some aspects of your life, you can just as easily create calendars for all these events.